Power Grid Fundamentals and Electricity Pricing
This eBook provides an overview of the structure and function of the electricity grid in North America. It explains the responsibilities of grid operators and explores the nature of grid supply/demand and pricing. This eBook is intended for energy stakeholders interested in understanding grid operations, and factors involved in delivery and pricing of electricity.
“We believe that electricity exists, because the electric company keeps sending us bills for it, but we cannot figure out how it travels inside wires.
Dave Barry // Syndicated Columnist
What’s your view of electricity? Perhaps it’s similar to Dave Barry’s view. You know it exists. You know you use it. But you don’t really know how it all works behind the scenes.
The Grid
What is the grid and who keeps it running? Properly speaking, the “power grid,” is the high voltage transmission system. It’s not the wooden telephone or electric poles that you see outside of your house. The grid is really the backbone of the larger electricity distribution system. It is the network of steel towers that transmits large volumes of electricity from the generating plants, wherever they’re located, to the users, the consumers, commercial industry, et cetera. The grid is a huge, humming, interconnected entity that also encompasses every electricity generator and every electric utility company connected to those wires. And every electricity generator that is connected to the grid is fully synchronized with every other generator at all times. In the United States, each of those generators is rotating at a speed of 60 cycles (hertz) per second. And the rate is very precise. There’s very little tolerance for deviation.
In the United States and Canada, the grid is segmented into three primary interconnected regions:
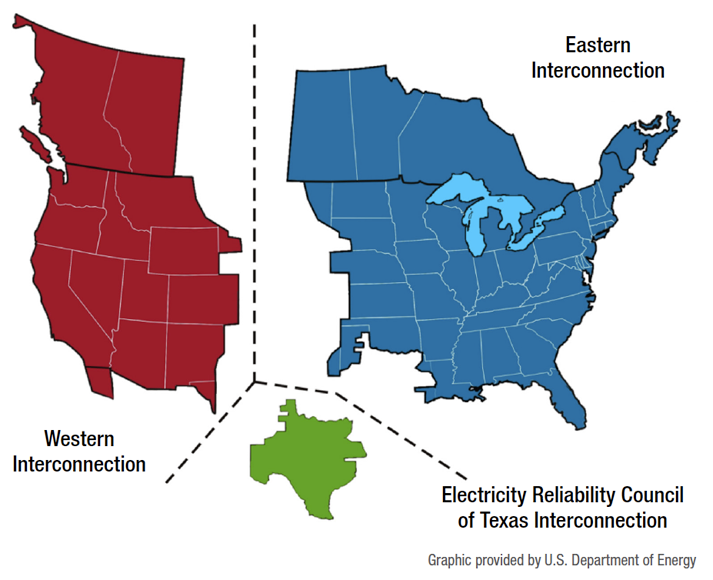
Why three grids instead of one? The reasons are geographical and geopolitical. The Eastern Interconnection and the Western Interconnection are divided by the Rocky Mountains. The logistics of maintaining the grid infrastructure over those distances and terrain make a full blown connection impractical. The Eastern Interconnection encompasses everything east of the Rocky Mountains and north of Texas. It is the largest of the regions, and could be thought of as the largest motor in the entire world. The Western Interconnection includes states and territories west of the Rockies. The third region is ERCOT—the Electricity and Reliability Council of Texas. It exists because of the determination of Texans to maintain grid operations within state borders, free of the federal regulation that follows interstate commerce.
Now, there are some ties between these three regions, but they are not synchronous ties. They are direct current (DC) ties. But within each of the primary regions, everything is completely synchronized, and any action that occurs within one of those grids can affect every other organization within the same grid. If a generator in Florida fails, the ripple effect can be felt up the east coast into Canada and throughout the entire Eastern Interconnection.
Transmission
So how does electric power get from the electricity generator to the end user—your home or business? First, let’s look at the variety of electricity generators. We have the coal-fired plants. There are also generators that run on natural gas or oil. There are nuclear-powered plants. Some generators have the potential to switch fuel sources depending on what source is the least expensive. There are also the renewables: wind, solar, and hydroelectric. Regardless of the fuel type, the generators don’t supply their power directly to residential customers, even if they’re nearby. Instead, the output of those generators passes through a transformer at a substation, where the electrical output is converted to a higher voltage to travel across the high voltage transmission system.
Why is this conversion necessary? It’s all about efficiency. When electricity is converted to a higher voltage, there are fewer line losses during transmission; that is, losses of electricity, usually in the form of heat. It is also easier to transport electricity over very long distances at the higher voltages (up to 768 kilovolts in the United States). So the transformer provides up-conversion from the voltage coming from the generator to the higher voltage handled by the high voltage transmission lines. This process in carefully monitored by a grid operator.
Grid Operators
There are several grid operators across North America. They are responsible for:
- ensuring that the transmission system is operating in a reliable fashion
- providing all generators with equal access to the grid
- balancing the output of generators with the ever-changing demand for electricity
- operating the grid’s resources as cost-effectively as possible
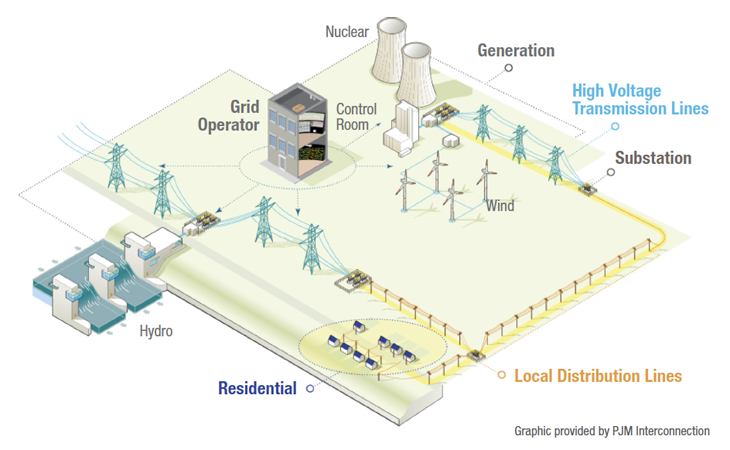
After the electricity has been transported for long distances via the high voltage transmission towers, it is converted down to lower voltages at substations. Then it can be transported on those wooden poles, down your street, and eventually to your home or business. By the time the electricity “arrives” at your outlet, voltage has been reduced to roughly 110 volts.
Depending on the rules in your state, you may work with a single electricity utility to both provide and distribute your electricity or you may have the choice to select your electricity provider (company responsible for procuring your electricity) separate from your local distribution company (LDC), which manages and maintains the local low-voltage distribution system.
Regulation
How is the grid regulated? The Federal Energy Regulatory Commission (FERC) is responsible for interstate trade of energy, including the electric grid. The FERC also oversees natural gas transportation across state borders. This oversight includes approval of tariffs; the FERC strives to ensure price fairness and non-discriminatory pricing for consumers. The FERC offices are located in Washington, D.C.
Within a particular state, regulations are typically managed by a state public utility commission. These entities approve electricity tariffs and rates for the LDCs, electricity providers, and consumers within their jurisdiction.
As a result of this overlap of responsibilities, there may be two different jurisdictions responsible for the trade of electricity in your area. But disputes involving interstate commerce will involve the FERC.
Grid Organization
In 1996, the FERC issued Order 888, which helped to break apart utility monopolies. As part of that effort, the FERC encouraged additional independence and transparency for grid operators and created a new term to classify and differentiate these entities—Independent System Operators. An Independent System Operator (ISO) is an organization that might not own any assets of the grid – their role is to manage the grid in a way that allows all participants fair and equal access. Their function is similar to air traffic controllers, who are tasked with managing the skies in a fair and efficient manner. The Federal Aviation Administration (FAA) doesn’t own the planes; their employees have a managerial/oversight role.
After ISOs were established, the FERC expanded some of the definitions for what those types of organizations could do in Order 2000. And in fact, they created another classification: Regional Transmission Organization (RTO). If an ISO is the equivalent of a bachelor’s degree, an RTO is the equivalent of a master’s degree. Every RTO has requirements that are above and beyond the requirements of an ISO.
An RTO can offer additional grid reliability in the form of ancillary services. RTOs are also more directly involved in planning and grid infrastructure development.
Electricity Supply and Demand
Grid management is an incredibly dynamic process. A helpful analogy would be to think of the “pool” of available electrical energy on the grid as a bathtub full of water with a spigot and a drain. The spigot is supply, and the drain is demand. But the drain aperture is constantly changing in size. The grid operators’ responsibility is to maintain the water level despite this uncertainty. When the drain gets bigger, the operators open the spigot a little more. When it shrinks, they close the spigot to reduce the supply.
On the grid, there is a constant tension or push and pull between the resources (generators) that are adding power to the grid and the consumers that are drawing electrical power from the grid to do work. Since there are few options for electricity storage, this balance can only be maintained by balancing available generation resources to match the current demand.
Whenever electricity is used, the drag on the system tends to slow the frequency, which must be kept constant to avoid damage to devices using the electrical current. The chart on the next page illustrates the frequency variation during normal grid operations.
Whenever the trend line is above zero, the grid is over-producing in comparison to grid demand. Whenever the trend line is below zero, there is more power being drawn from the system than is currently being supplied. Grid operators try to keep that trend line as close to the center as possible. Typical boundaries (measured in hertz) would be from 59.95 to 60.05. If these tolerances are exceeded, certain grid equipment has automated procedures for self-regulation that may include automatically shutting down equipment or turning off electricity for some users. Grid operators are constantly managing the system to ensure that these more extreme actions are not required.
Electricity Pricing
Now that we understand more about grid operations, let us examine how prices for electricity are determined. The dynamics and variation of pricing may surprise you.
In the “old days” prior to some of the organizational changes brought about by the FERC actions, electricity prices were often set by utility companies and approved by state utility commissions. The rates were often determined based on the concept of cost recovery. The more that the utilities spent on infrastructure and generators for production, the more returns could be “justified.” Those returns were, for the most part, set as a percentage of the total approved investment cost (rate base). While these types of returns provided limited risk for utility investors, from a consumer’s perspective, there was too little incentive for efficiency and conservation activities that would serve to lower consumer prices.
The FERC has tried to provide that incentive by requiring segmentation of the business operations of electrical distribution, transmission, and generation, even if those operations are performed by the same corporation. The purpose for this segmentation is to take the financial risk of constructing expensive generators off the electric consumer and place that risk on the shoulders of investor-owned corporations. For instance, Exelon, a very large utility company in the United States, owns generators, grid transmission equipment, and distribution companies that distribute electricity to individual consumers (e.g., PECO, ComEd). However, the FERC requires Exelon and other similar organizations to create organizational-structural-financial barriers within their companies. In practice, these companies are barred from sharing operational information between their generation portfolio and their transmission portfolio. This division is intended to ensure that everyone who uses the grid is treated fairly and doesn’t have an advantage, one over another. And that’s really where competition comes into play, because as the generator businesses compete for a share of the electricity market, competition drives down the cost of electricity for all consumers.
Day-Ahead and Real-Time Energy Markets
Grid operators project anticipated demand well into the future for planning purposes. But most procure actual generation capacity through two related electricity market mechanisms: the Day-Ahead Energy Market and the Real-Time Energy Market.
The Day-Ahead Energy Market (DAM) is a financial market where participants purchase and sell electricity at financially binding day-ahead prices for the following day. For instance, on a daily basis each participating generator will provide an hourly rate for the electricity they are willing to provide during the next day, along with their output, possibly including tiered (block) pricing depending on the amount of energy purchased during each hour.
Up to 98% of the anticipated load is procured using the Day-Ahead Market, depending on market design and market confidence. The DAM allows buyers and sellers to lock in their price and hedge against volatility in the Real-Time Energy Market, where additional actions and transactions must take place to respond to real-time conditions.
Let’s see how this is done using a real world example. The black line on the graph below represents the electric load curve for a single day for the grid operator. This is the aggregate electricity usage of all consumers within a particular grid region.
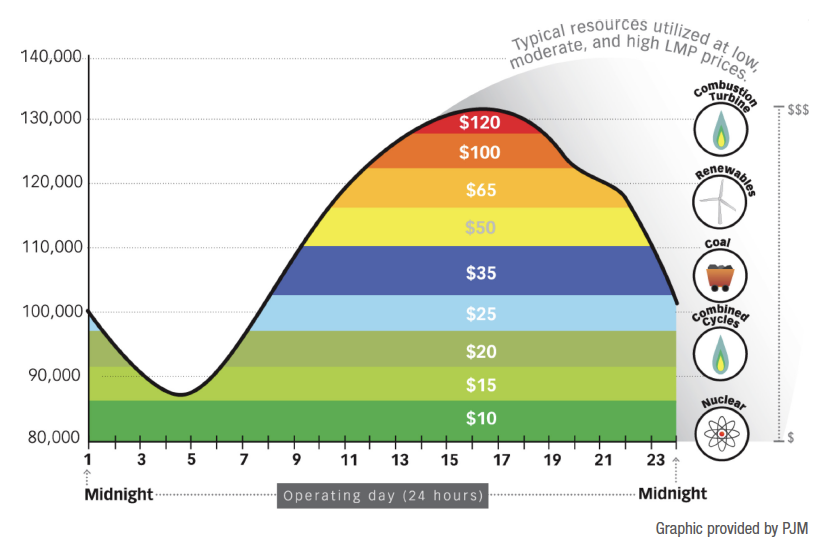
Initially, demand is close to 100,000 megawatts. Then the trend line dips down, then back up, and finally back down in the evening. The grid operator is constantly working to predict what this demand curve will look like today, tomorrow, and even a week in advance. They use historical load curves and weather patterns to predict the exact amount of electricity that will be used at all times throughout the day.
The grid operator may set a regular deadline of noon for submitting bids and offers for the DAM, and any participating electricity generator must submit tomorrow’s hour-by-hour pricing offer into the DAM before the noon deadline. The offer will include how much energy they can and will provide, and how much it will cost. The offer may include tiered (block) pricing based on the amount of energy purchased.
A sophisticated DAM software package analyzes the demand forecast and all available energy resources and costs in a two-stage process. The software can often run for several hours while it determines how to best match grid demand and infrastructure capability with the energy available. A variety of factors contribute to the final outcome, including generator prices and production capacity, location of generators, the capability of each piece of transmission equipment, known equipment outages, generator start-up and shut-down costs, and many other variables.
The DAM then selects generators based on the most favorable (least-cost) scenario that also ensures reliable operation of the high voltage transmission equipment. Essentially, the DAM software “stacks up” generators based on their price and makes selections that are both cost effective and reliable.
In the Real Time Energy Market, grid operators are continuing to monitor and predict load throughout their region. They often predict and make decisions on last-minute generator changes (additional/fewer generators and different generator output levels) 20 minutes to three hours in advance. Final decisions on output for each generator are made and sent to generators electronically on a constant basis.
Locational Marginal Price
In electricity markets, price is not simply based on time of day or availability. There is a “cost” involved in actually transmitting electricity through the grid. This cost is measured by practical limits of the transmission infrastructure, as well as line losses associated with the transmission.
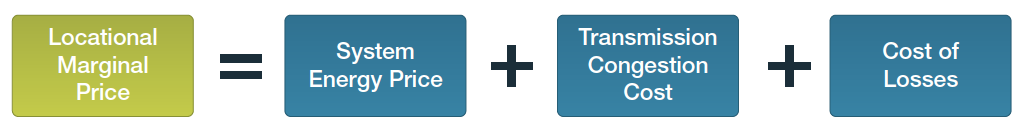
Generators are selected for use by grid operators in part based on how available their electricity is for the rest of the grid. Although a generator may not be the least expensive generator, it may be the only one available to deliver power when needed due to “constraints” on the transmission system. This results in a higher electricity price.
Likewise, customers pay, in part, based on how easy it is for the grid companies to get inexpensive power to them. If they are in a location where it is difficult to provide power from inexpensive generators, the Locational Marginal Price (LMP) helps reflect that difficulty. Customers in areas where expensive generators must be turned on to provide their power will be responsible for the additional costs of those generators.
As mentioned previously, prices on the electric grid are dynamic. They can change every five minutes, based on which generators are producing, what line losses are associated with the system, and how difficult is it to get power from one part of the grid to another given the limitations of the high voltage transmission system.
Graphically, this is what dynamic electric pricing looks like.
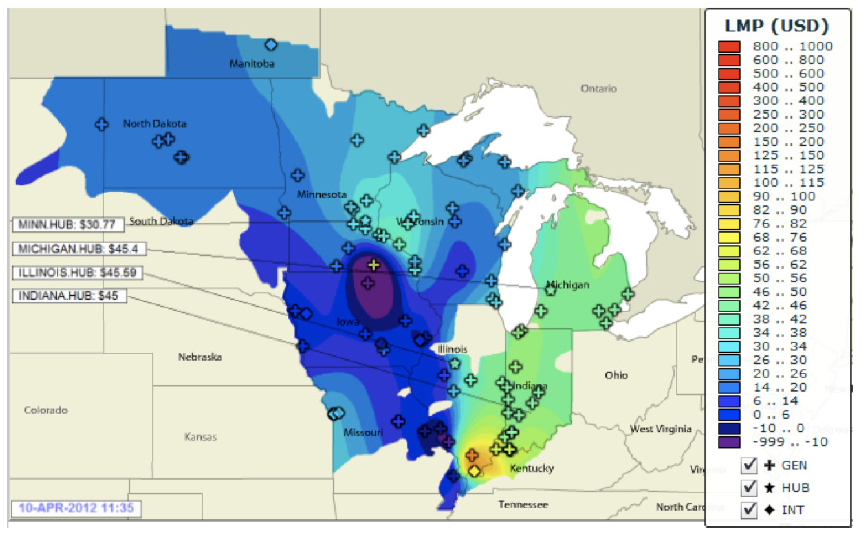
This is a representation from the Midcontinent ISO (MISO) and their pricing for a particular moment in time on the electric grid. The colors represent a variety of different prices. As you can see, prices in some areas are very low. In fact, they may even be negative, an anomaly that we will address in detail shortly.
In other parts of the system, the prices are quite high. If you look at pricing in western Kentucky or the southern part of Illinois, they are much higher. Remember—the price is based on three factors:
- The costs of generators used.
- The location of the generators and end use customers.
- Additional generation required to overcome losses on the system.
The higher prices in the eastern region are most likely due to limitations with transmission lines that are close to being overloaded. As a result, more expensive electricity generators are being turned on in the east, contributing to the price differential.
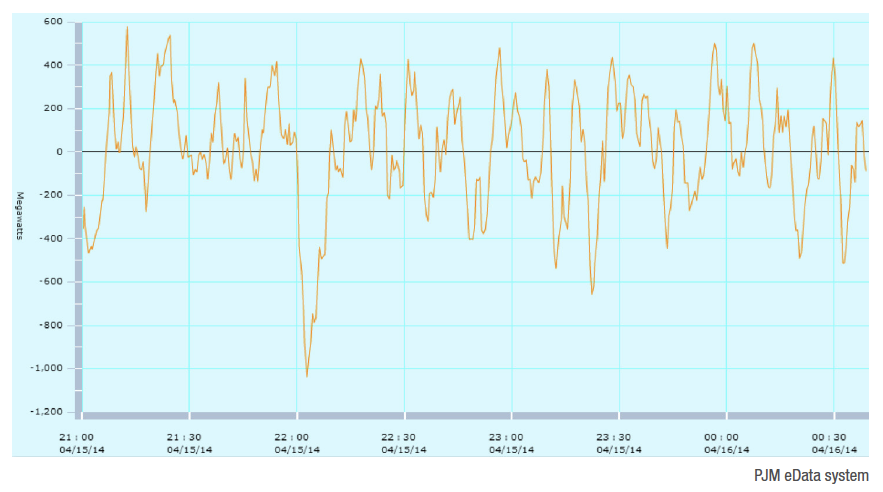
On the next page is another example from Superstorm Sandy—this graph is from PJM Interconnection—an electricity grid operator responsible for delivery of electricity in 13 states and the District of Columbia.
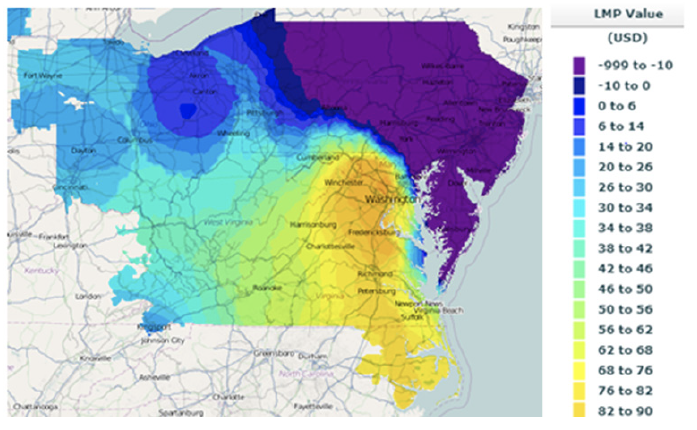
In this particular case, Superstorm Sandy hit the Northeast and downed power lines, blacking out portions of Pennsylvania and New Jersey. As a result, demand was effectively reduced to zero, and prices in that part of the grid went negative. The grid was overproducing in that area, and generator companies would have paid big bucks to anyone in the northeast who would use their energy, so they wouldn’t have to spend time and money shutting down and idling generators that might take days to get back online. In those types of circumstances, it is more economical to pay consumers to use electricity in certain areas than it would be to curtail energy production. So, negative prices do exist on the grid, even if we don’t see them in our retail electric bills.
Factors Affecting Demand
We have discussed factors affecting electric pricing. But what factors influence demand? The biggest two influences on electricity prices are weather and human behavior.
The two charts below represent a weekday load curve in summer and in winter—how much electricity is being used in the summer versus how much electricity is being used in the winter.
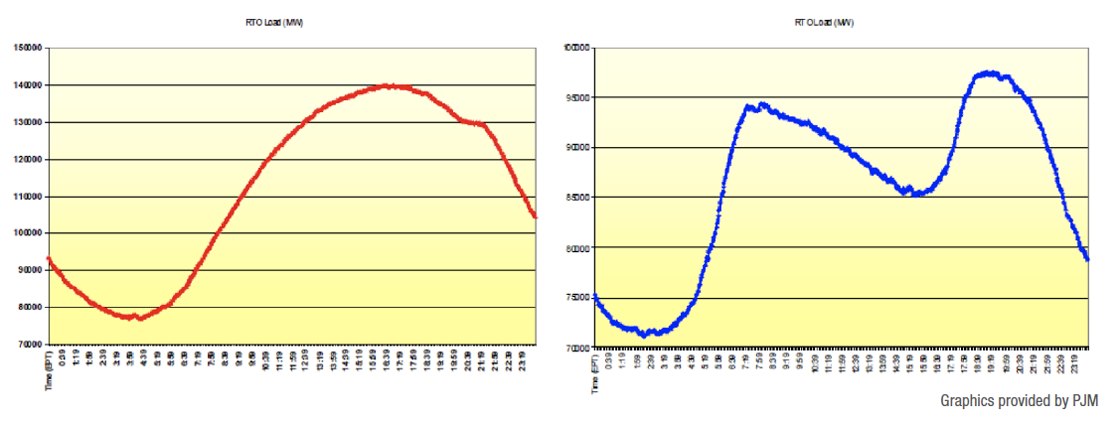
As you can see, the scale for each graph is different. The summer peak is close to 150,000 megawatts, but in the winter, it’s around 100,000 megawatts. That difference in magnitude can be explained in two words: air conditioning. In summer, as temperatures rise during the day, more and more air conditioners are turned on. This explains the steady increase in electricity use as the day gradually warms up.
By contrast, the winter increase is more angular. We see a very steep change in electric use relatively quickly as people are getting out of bed and turning on more lights and heating systems. These types of changes are very difficult for a grid operator to manage. But then during the day, once buildings have heated up, there is often a gradual decline in electricity usage. As people return home at night, we see a secondary peak for lighting and heating that occurs primarily at the residential level. This human behavior, factored in with weather, determines how much electricity the grid operator has to supply throughout the day.
Grid operation becomes a kind of balancing act, juggling supply (and demand) through a combination of art and science. The art is in the forecasting of electricity use for a dynamically-changing grid with demand determined by a myriad of individual choices. The science is in the analytics, which blends historic and real-time data to produce the very best guess about the electrical resources that will be required. Grid operators also need to schedule the cheapest generation possible, acknowledging that not every factor is theirs to control. They also have to make sure that at no point in time are they damaging the transmission system, burning down lines or causing problems that would have a long-term effect on the grid. And they must react quickly to unexpected changes. Suppose, for instance, that a steel plant operator suddenly fires up all the company’s furnaces. In that particular situation, the grid operator has to suddenly react to a huge change in demand in a very small area of the grid. Those types of changes occur all the time.
As we have seen, daily demand variations produce corresponding variability in pricing schedules. There are peaks and valleys. The peaks represent the highest cost for electricity, while the valleys represent opportunities to run more cost effective generators and produce savings for the consumers.
Unfortunately, consumer pricing is often flat rate pricing. You don’t get “extra credit” or a reduction in your monthly utility bill for turning on your dishwasher at 2:00 a.m. In many instances, utility companies cannot legally charge variable electricity rates to consumers–prices that rise and fall with the prices on the grid. And consumers can’t take advantage of unique negative pricing events. But it is conceivable that Smart Grid technologies may change that. Perhaps in the not-too-distant future, you may be able to charge your electric car at 1:00 a.m., use it as a battery, and sell its stored energy back to the grid the next afternoon!
The Grid and Capacity Markets
How does the grid respond to unusual situations? What happens when weather and/or human behavior combine to create abnormal demand loads? In these cases, the grid operators must plan for the unexpected and prepare for the worst.
These worst-case scenarios are often not handled solely by the standard electricity markets (DAM and Real Time Market). Instead, there are additional electricity markets and ancillary services which provide for these particular situations.
Capacity market providers are a kind of insurance to ensure that the grid will have enough available generation to meet demand–even on the most challenging of days. In addition to any real generation that they provide in the DAM and/or Real Time Market, they are also funded via capacity charges, which are often itemized on your utility bill. Capacity markets help ensure that all customers have electricity whenever they want to use it. The grid operators plan for only one controlled blackout every ten years. That’s an input to the statistical model that they use in their calculations to ensure an adequate power supply sometimes years in advance of when the electricity will be used. Grid operators use forecasting and statistical analysis to determine what future use–meaning use one to five years into the future–might look like.
These capacity charges that we all pay as consumers or businesses provide a daily revenue stream to ensure that those generators that are used very infrequently, but are yet critical to the reliability of the grid, have an adequate revenue stream to stay in business. So another term for capacity charges is “demand charges.” If you look at your electricity bill, especially as a business user, you will notice that there are demand charges. Those charges go to pay for the capacity market providers that ensure the reliability of the grid on those peak days during the year.
Below is an example of load curves that compares peak electric use during different seasons of the year.
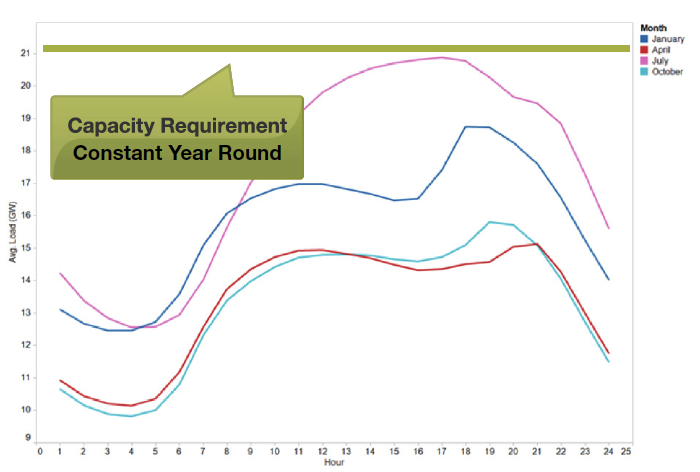
And you can see that in April and October, the use profile is much lower than in the summer. This is because the combined heating and cooling demands are minimal. But unfortunately, grid operators cannot plan for these best-case use scenarios. They can’t suddenly build more generators or transmission lines when the summer hits. It is necessary to have generating capacity “on call” to meet those summer and winter peaks.
So the capacity requirement ends up being based on the worst use day of the year (peak load) plus a buffer. The grid operator must be prepared with available generation capacity to meet that summer peak, and then some. Those demand costs are passed on to consumers through the entire year. Often, consumers and commercial users fail to realize how lowering their electricity usage on peak days in the summer can translate into direct savings by reducing the demand charges that they pay on their monthly bills.
In addition to capacity payments, there are other grid services like regulation, spinning reserves, black start, and reactive services. These are other types of services that grid operators need to have, or tools that they have in their toolbox in order to ensure grid reliability. They refer to how fast generators can respond when there are problems, how much reserve there is available to be called onto the system within 15 minutes, what happens if you have to restart the grid up following a blackout, and how to sustain required voltage levels on the system at all times.
The Grid and Your Utility Bill
When you add up all of the services provided by electricity suppliers, grid operators, and distributors, what does it look like in terms of your utility bill?
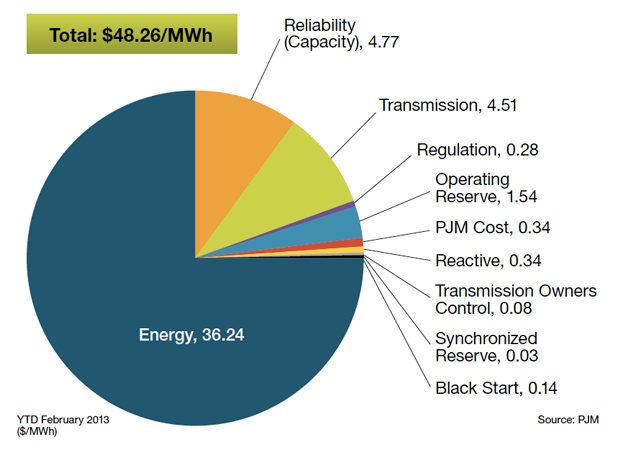
This is a sample of total billed charges from PJM during the beginning of 2013. At that time, you can see that more than 75 percent of consumer cost went to pay for the electricity they consumed. This makes sense—the more electricity you use, the higher your costs will be. However, the second highest payment amount is dedicated to capacity or demand charges. As a consumer or a business owner, you can control this capacity charge to some extent. If you are tracking daily electric loads, you can determine when your peak days are. If you can curtail your energy use during those peak days during the year, you can save money on your electric bill all the time.
The remaining items on your bill are generally specialized services—transmission services for maintaining transmission lines, grid response services (previously discussed) and (of course) taxes.
The costs described above are for electricity supply and grid services. Your local distribution company (LDC) will also add their fees/services to your monthly electricity bill.
“Edison’s greatest achievement came in 1879 when he invented the electric company. Edison’s design was a brilliant adaptation of the simple electrical circuit: the electric company sends electricity through a wire to a customer, then immediately gets the electricity back through another wire, then (this is the brilliant part) sends it right back to the customer again. This means that an electric company can sell a customer the same batch of electricity thousands of times a day and never get caught, since very few customers take the time to examine their electricity closely.”
Dave Barry // Syndicated Columnist
 Best-in-class portfolio-level energy and utility bill data management and reporting.
 Real-time energy and sustainability analytics for high-performance, net-zero buildings.
 A holistic view of financial-grade scope 1, 2, and 3 carbon emissions data across your entire business.
 Energy and sustainability benchmarking compliance software designed for utilities.