How to Create an Energy Reduction System Plan
In January 2019, Pennsylvania Governor Tom Wolf signed Executive Order 2019-01, titled “Commonwealth Leadership in Addressing Climate Change and Promoting Energy Conservation and Sustainable Governance.” The Order mandated that “all agencies under the Governor’s jurisdiction shall collectively reduce overall energy consumption by 3% per year, and 21% by 2025 from 2017 levels.”
The energy reduction directive was like dozens of others enacted by state and local governments and other organizations: Reduce energy consumption by a designated percentage in a future year, compared to a historic baseline year. Pretty straightforward, right? In concept, yes. In implementation, not so much.
HOW ENERGYCAP CAN HELP
If you are challenged to meet a mandate, you could probably use some help. Instead of using up your team’s labor hours on this lengthy process, EnergyCAP can do it for you, freeing you up for higher-level planning and analysis.
EnergyCAP’s CAPture Services team can work with you to establish a plan for contacting your vendors or internal teams and gathering the historical billing data. After the identification of data sources and collection of the data, the CAPture Services team will then import the data into EnergyCAP and perform quality assurance testing to ensure accuracy, spot gaps in data, identify anomalies, audit the bills, and create follow-up flags on the potential issues.
EnergyCAP will continue to obtain and process your utility bills and can even resolve billing issues with your vendors, so you don’t have to. (Tip: When contracted about an incorrect bill, your vendor is likely to address it a bit more urgently if the bill has not yet been paid.) Additionally, once your bills are audited and approved, they can be delivered in an import-ready file to your AP system for payment, eliminating the need for redundant data entry.
While gathering and centralizing historical energy use and cost data can be a daunting task, it’s a required first step toward meeting an energy reduction mandate. After the historical data has been loaded into EnergyCAP and verified, an extensive library of reports, charts, and dashboards will provide the baseline data you need to begin your pursuit of the energy reduction mandate.
For more detailed information about centralized utility bill processing, please take a few minutes to read “A Primer on Utility Bill Processing.”
Identify Energy Savings Opportunities
Part One covered the importance of establishing a baseline, as well as the challenges that come with centralizing and verifying a large organization’s substantial and diverse energy data. Here, in Part Two, we discuss ways you can use your now centralized data to identify energy- and cost-saving opportunities, including billing errors, malfunctioning meters, facility and utility account ownership issues, and others in pursuit of your reduction goals.
Benchmarking
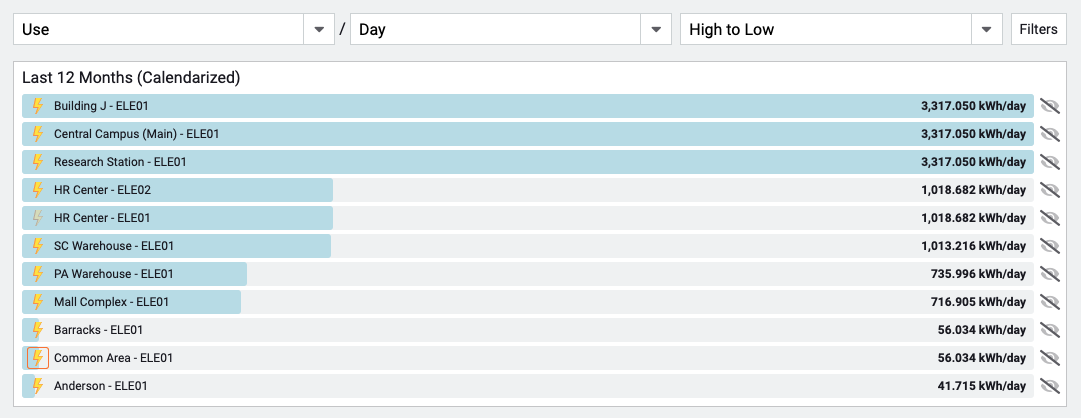
Benchmarking is the practice of comparing the energy use of peer facilities via specific criteria, such as use/cost per square foot, per day, per student, per room-night, per widget produced, and others.
Benchmarking is a quick way to develop a shortlist of potential energy hogs that warrant inspection for savings opportunities.
Following are commonly used benchmarking resources:
1. Utility Company Reports
Your utility vendors may provide regular reports that show how your energy use compares to similar utility company customers. They’re great because they’re free, and they give you a general idea of your building’s energy efficiency.
One drawback to these reports is that they don’t account for all the variables related to your energy use. They may alert you to potential issues, but they often don’t provide enough detail to help you take corrective action.
2. ENERGY STAR Ratings
While this step may not be a requirement of your specific energy reduction mandate, local municipalities often separately require that energy use data for facilities is submitted to ENERGY STAR’s Portfolio Manager application on a quarterly or annual basis. Facility ENERGY STAR scores are then required to be publicly accessible or at least available for review by potential buyers or tenants.
The Portfolio Manager application benchmarks buildings against their peers and assigns a score, or ranking, of 1–100. An ENERGY STAR building score of 75, for example, indicates that, from an energy efficiency perspective, the building performs better than 75% of its peers.
The ENERGY STAR score is a relatively straightforward way to evaluate facility energy consumption and communicate the performance of your entire portfolio compared to a large national database of facilities. Note that your buildings may not always perfectly align with ENERGY STAR categories, and not all building types are eligible for an ENERGY STAR rating.
3. Industry-Specific Benchmarking
It’s common for industries and trade groups to supply their own benchmarks. An industry-related benchmarking system is likely to be very relevant to your facility portfolio and, therefore, can be quite useful, assuming the sample size of peer facilities—similar building types, use, geographic location—is statistically significant.
4. Software Tools
Benchmarking is a feature you’ll often find in energy management software. For example, the Groups & Benchmarks feature in the EnergyCAP UtilityManager automates peer benchmarking and allows the user to benchmark facilities via custom or industry-specific factors, such as hours of operation or building occupancy.
Bill Audits
You never want to pay for energy you didn’t use, which is why bill audits are so useful. Your organization’s utility bills are packed with data that can be inspected for errors, and identifying those errors can result in substantial cost savings. Utility bill audits typically fall into four categories:
1. Date Audits
As you might expect, date audits revolve around comparing utility bill date information. The start and end dates of your bills, the statement date, the due date, and the billing period length are all important dates to check.
We recommend that you begin your utility auditing process with a focus on date accuracy. Date audits that may reveal data entry errors or other billing-related issues include the following:
- Billing Period Length is abnormally long or abnormally short
- A gap between End Date of last bill and Start Date of the current bill
- Bill End Date is later than today
- Due Date or Statement date is before the End Date
- Bill Start/End Dates overlap with another bill
Date audits are useful because date-related errors lead to incorrect energy analytics and untrustworthy audit results. When you’re comparing different billing periods to determine the average daily use or average daily cost of a facility, it’s essential for all dates to be correct.
2. Energy Use Audits
Energy use audits expose incorrect meter reads, faulty meters, billing errors, and data entry errors. The first time you perform an energy use audit, you may reveal persistent issues and problems that can save your organization tens or even hundreds of thousands of dollars.
Here are some examples of energy use audits that may reveal billing issues:
-
- An account has several consecutive estimated bills. Too many consecutive estimated bills indicates that the utility vendor can’t access the meter.
- Use-per-day is identical to the prior bill. It’s extremely unlikely for commodity use to be the exact same for consecutive billing periods. When this happens, check to see if the bill is estimated.
- Cost without use. If you receive a bill with a cost attached to it but it shows no commodity use, it could mean that the meter is inactive and should not incur expenses.
3. Cost Audits
Cost audits can also help uncover faulty meters, billing errors, and data entry mistakes. They can be a bit trickier to perform, however, since utility rates can change significantly between billing periods due to electric demand, seasonality, use, and ratchet situations. Nevertheless, there are a few audits you can perform to check for savings opportunities:
-
- The cost-per-day for a meter is higher than previous bills. For meters that are relatively steady month to month, a higher cost-per-day could indicate that there’s an issue. When performing this audit, also look at the monthly cost and unit cost data for additional insights.
- Year over year changes. This audit is better for meters that experience seasonal changes. If the cost-per-day or unit cost is notably different from the same month of the previous year, it’s worth a closer look. This jump could indicate a rate change or increased usage.
4. Demand Audits
Demand audits only apply to electric bills, but they’re still very useful. Demand is the potential “peak use” (maximum kW) of a meter for a billing period. The electric supplier must be prepared to supply this demand at any time, and they often charge a rate premium based on this use that can impact your rates in future months.
You can reduce your peak energy use through retrofits, load reallocation, and other practices. For example, a school system can reduce its demand by using the Art department’s pottery kiln when the school’s kitchen is not in use.
Any industry that has flexibility when it comes to scheduling energy-intensive activities should make use of load reallocation.
Here are a couple important demand audits:
-
- Impossibly high load factors. Any load factor over 100 percent is impossible, so this automatically indicates a billing error.
- The demand is higher than all the previous 12 months. Like cost and use audits, this audit leads to asking if the demand is reasonable.
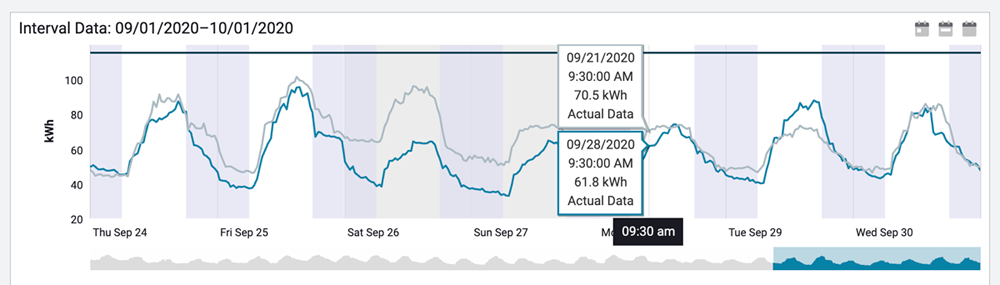
Interval Data
If utility bill data is the energy management world’s superhero, interval data is its critical sidekick. While utility bill data presents a valuable big picture view of energy use and cost, interval data zooms in to help you understand how much energy is being used and when.
Interval data is recorded by the vendor meter or through a self-installed submeter that tracks usage details in smaller increments. This enables you to ask and answer questions, such as:
- Does this building start using energy at the expected time each day?
- Does energy use decrease or stop as expected during the evenings and on weekends?
- Are there any spikes in demand that could be pushing up costs?
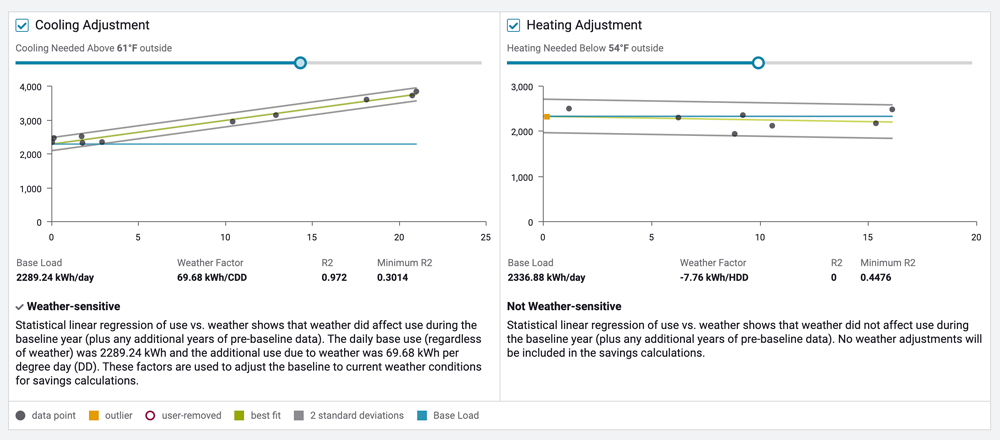
The positive line slope in the left-hand image illustrates that more energy is consumed as cooling degree days increase (reflective of increasing daily mean temperature), confirming that consumption measured by that utility meter is impacted by the weather. Therefore, in a year where temperatures are above average, the facility is likely to consume more energy, even though steps may have been taken to increase energy efficiency. Comparing monthly or annual energy use after weather has been removed more accurately reflects the impact of energy conservation efforts…
…but to get an even more accurate evaluation, additional factors should be accounted for, and that’s where the concept of Measurement & Verification comes in.
Measurement & Verification (M&V)
The measurement and verification (M&V) process compares current energy consumption with consumption in an adjusted baseline year to calculate the amount of energy you avoided using due conservation efforts. Certified M&V processes automatically account for major variables, such as weather (degree days), billing period length, floor area changes, and commodity price, in addition to allowing for special adjustments related to changes in occupancy, schedule, and equipment retrofits.
While comprehensive M&V calculations are relatively detailed and complex, the process can be summarized in three primary steps:
Step #1—Establish a baseline year. Typically, this period is the twelve months immediately prior to the implementation of the energy management initiative. The baseline year is typically announced in energy reduction mandates. For example, the Commonwealth of PA’s mandate established 2017 as the baseline year.
Step #2—Adjust the baseline to today’s conditions. When all known variables—weather, billing period length, square footage changes, etc.—have been accounted for, you will have an energy cost value for the Baseline Year Adjusted To Current Conditions, which is referred to as the BATCC in EnergyCAP.
Step #3—Compare the BATCC to the current utility bills. The BATCC value reflects the amount of energy that would have been consumed without any energy conservation measures. Compare that amount to the actual consumption shown on the current utility bill, and the difference is the amount of energy not consumed due to increased energy efficiency.
Developing an accurate M&V model on your own will be a very time-consuming process and requires a high level of expertise. It’s much more cost effective to license an off-the-shelf application, like EnergyCAP, that provides M&V functionality that meets IPMVP standards.
Inform and Motivate
Laurence J. Peter is credited with the adage, “If you don’t know where you are going, you will probably end up somewhere else.” Your organization’s energy reduction mandate established the goal or destination, and the multi-year effort will require organizational buy-in—from the top-ranking executive to the rank-in-file employee. Getting that commitment and sustaining it to the point that energy and environmental conservation are engrained in your organization’s culture require clear and consistent communication.
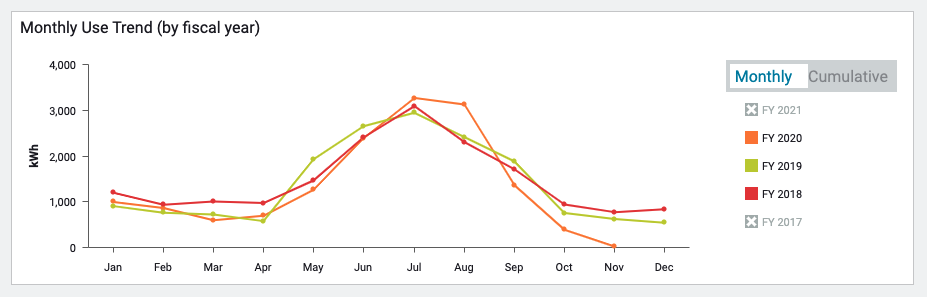
Set Yearly Targets
Start the communication process by breaking your multi-year goal into more manageable monthly or annual bites; make the long-term destination seem less daunting. The short-term goals should be communicated to your facility managers and building occupants in a format that is visible, easy to understand, and updated consistently, such as this target line Powerview from EnergyCAP:
Automated Reports
Having access to and sharing data is critical to the success of any energy conservation effort. Earlier, we outlined the types of reports that we feel will provide the actionable data you and your team will need to consult consistently. The one glitch we have found over our 40+ years of experience is that you can’t assume that your team will remember to generate the reports. And if they don’t produce the reports, they will either make uninformed decisions or fail to act at all, and the conservation program is destined to fail.
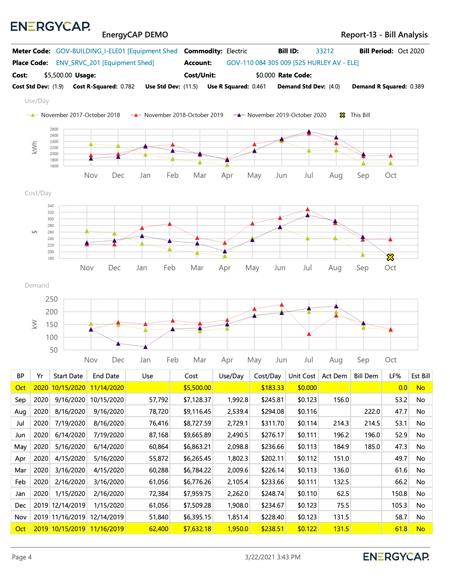
Ideally, you will overcome the reporting challenge by using an application that enables users to subscribe to reports and have them generated and emailed automatically. In EnergyCAP, for example, reports can be generated on a calendar basis (e.g., daily, weekly, monthly, or quarterly) or only when certain criteria are met. An example of the latter is the Bill Analysis report (right) that employs quadratic regression models for energy use, cost, and demand to highlight utility bills that appear to be abnormal and should be reviewed.
You can learn more about EnergyCAP’s Bill Analysis report here. Constructing a similar type of report in Excel or other business intelligence tool may be doable, but be prepared to invest a substantial amount of effort to create and maintain it.
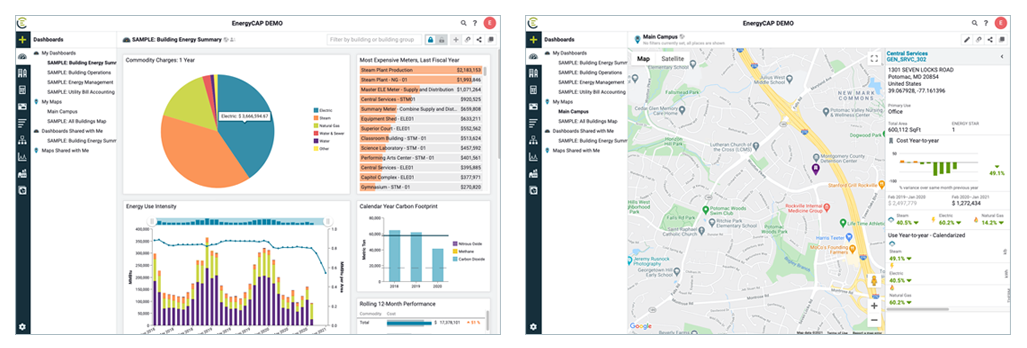
Dashboards
A decade ago, organizations attempted to encourage energy conservation by setting up energy use displays or kiosks in building lobbies. Some cited benefits, but most confirmed over time that the easy-to-ignore displays did little to encourage energy conservation or change building occupant behavior. Today, the ineffective lobby displays have been replaced with online energy dashboards, and the online displays offer multiple advantages:
- Easy to access from home, office, or mobile device; not limited to building occupants
- Can be built and customized by any authorized system user; no special design, video, or graphics skills required
- Informative and easy-to-understand “real-time” content
When you’re pursuing an energy or emissions reduction mandate, the biggest advantage of online energy dashboards is they will keep you and your organization accountable. A dashboard that displays your objectives to every member of your organization and even, perhaps, to the public is a constant reminder of your mission and how far you have to go to meet complete it.
Select a tool that allows you to display the high-level and detailed data that will motivate your audience—those who work for and with your organization—to help you achieve your conservation mandate.
HOW ENERGYCAP CAN HELP
We developed this resource to serve as a guide to those tasked with meeting an energy or emissions reduction mandate, recognizing that the information provided is relevant to any organization embarking on a mission to conserve energy and lower utilities costs.
As with any major undertaking, multiple paths may lead to the same outcome. However, some paths are much more challenging and require a higher level of effort. We’ve all learned that the shortest distance between two points is a straight line. At EnergyCAP, we’ve spent 40 years developing an award-winning utility bill accounting and energy management solution that is the “straight line” to long-term energy conservation success.
If you’re tasked with meeting an energy or emissions reduction mandate and want to take the path that’s proven to be easier, smarter, and friendlier, contact us to learn more about EnergyCAP. I also encourage you to read our field guide, “How to Spec and Purchase and Energy Management Information System” as you begin your research.
 Best-in-class portfolio-level energy and utility bill data management and reporting.
 Real-time energy and sustainability analytics for high-performance, net-zero buildings.
 A holistic view of financial-grade scope 1, 2, and 3 carbon emissions data across your entire business.
 Energy and sustainability benchmarking compliance software designed for utilities.