Energy benchmarking is a way of deriving value from your available energy data by comparing the performance of multiple peer group members. It’s a way of determining how a place, building, or meter ranks in comparison with other similar places, buildings or meters. You can get the energy information from your utility bills.
By comparing peer accounts, meters, or buildings, you can prioritize energy management actions. Your benchmarking processes will help you quickly pick winners and losers; the losers would typically be the ones that you would want to audit and/or or retrofit first.
For example, suppose that you have two buildings that are very similar. They were built on the same floor plan at about the same time, but one ranks much lower than the other for energy efficiency. Perhaps the building is being operated poorly. There could be control problems.
Benchmarking may not initially reveal specific issues, but it will help you focus attention on the problem building. And as you investigate, benchmarking may be able to reveal even more. If you find a building that ranks poorly, and a preliminary building analysis does not reveal problems with the building, then you might dig deeper and discover a meter problem or a billing problem.
So what metrics should we use to get the most out of our benchmarking system? Total use and total cost are easy to find on utility bills, but often the best information can be derived by using what you know about each building to leverage the use/cost data.
Following are three recommended benchmarking metrics:
Tip #1: Annualized Cost per Square Foot
To eliminate seasonal weather variations and building size as factors for comparison, try measuring Annualized Cost per Square Foot. Divide the total annual energy cost by the floor area of the facility served by the meter. If you have more or less than 365 days of cost data, make adjustments to “annualize” it so that the results are not skewed when comparing facilities. Then take the daily cost figure and divide it by the square footage of each facility. The resulting metric is much more powerful and meaningful for comparing similar facilities.
Tip #2: Peak Demand per Square Foot
To compare peak demand, you should make certain to select peer buildings that have similar equipment or similar primary uses. For each meter, find the electric bill with the highest KW demand for the year and divide by the floor area of the building served by the meter.
If data is not similar for peer buildings, the outliers may have controllable loads that are not being controlled. As a result, peak demand penalties may be driving up the utility costs. Those facilities with the highest KW demand per square foot should be investigated for billing problems, data errors, and/or inefficient electric equipment.
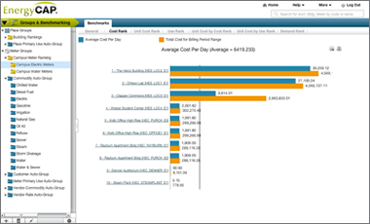
Tip #3: Cost Per Unit Ranked by Total Cost
For this metric, calculate the average unit cost (total cost divided by total use) for each account. You will need to do this independently for each energy commodity. Then rank results for each commodity in order from highest total cost to lowest total cost.
Your high-volume accounts should have the lowest average unit cost due to the more favorable pricing offered through many high volume rate schedules. Investigate anomalies and look for opportunities to move to a more favorable rate.
Planning an energy retrofit? Check out a helpful webinar.
{{cta(‘e0abeb56-77e8-4259-9164-15acb12754bd’)}}
 Best-in-class portfolio-level energy and utility bill data management and reporting.
 Real-time energy and sustainability analytics for high-performance, net-zero buildings.
 A holistic view of financial-grade scope 1, 2, and 3 carbon emissions data across your entire business.
 Energy and sustainability benchmarking compliance software designed for utilities.