


For most organizations, energy and utility costs sit quietly in the background; processed, paid, and filed away as a routine operating expense. But that mindset is becoming increasingly risky....


Headquarters
EnergyCAP, LLC
360 Discovery Drive
Boalsburg, PA 16827
Denver, CO
Suite 500
5445 DTC Parkway
Greenwood Village, CO 80111
Dublin, Ireland
Unit F, The Digital Court, Rainsford Street,
Dublin 8, D08 R2YP, Ireland
Phone: 877.327.3702
Fax: 719.623.0577

Building energy monitoring tracks electricity, gas, steam, and water use across your facilities to spot waste, reduce costs, and decrease usage. In the U.S., average retail electricity prices reached 12.94¢/kWh in 2024, and national prices have risen about 23% since 2019, so visibility into when and where you’re using energy matters more than ever.
Building energy management systems (BEMS) pull data from meters, submeters, and controls into a single platform for constant monitoring, alerts, and performance insights. Explore energy monitoring systems for commercial buildings, along with tips for identifying the best solution.
A BEMS collects interval data from utility meters and submeters, integrates with other data sources, and turns it into trends, alerts, and KPIs to act on. They provide detailed visibility, flag abnormal use, and support measurement and verification (M&V) to confirm savings after changes.
Most commercial buildings still waste around 30% of the energy they consume, which is why portfolio-wide monitoring and follow-through can deliver outsized returns.
What you gain with a BEMS:
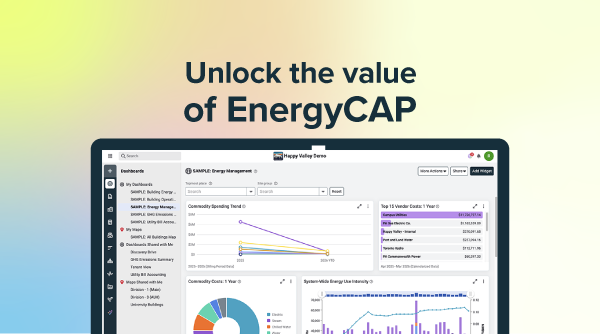
EnergyCAP, a building energy monitoring platform, integrates meter and submeter data, utility bills, and KPIs into a single view, so teams can prioritize changes, validate savings, and scale results across their portfolio.
A building energy management system (BEMS) shouldn’t be another tool to juggle; it should be the piece that makes your energy data usable in everyday decisions. Here’s a quick look at how the right platform turns utility bills, meter, and submeter data into clear actions and verified savings.

Pipe monthly bills and vendor accounts into EnergyCAP Utility Management for GL-ready accounting, bill audits that save you money, and portfolio-wide insights. Stream interval data from utility meters and gateways into Smart Analytics for building energy monitoring, alerts, and KPIs.
Track interval use and demand in near real time, set alerts for off-schedule loads and demand spikes, and act the same day to prevent waste. Convert fixes into verified savings with M&V so the impact shows up in monthly variance and GL reports.
Benchmark your assets, from a single meter to your entire portfolio, with Use and Cost Intensity metrics, weather-normalize usage, and surface outliers quickly. Use Powerviews and dashboards to quickly see critical metrics, communicate with stakeholders, and unify energy, facilities, and finance teams.
After schedule tweaks, energy conservation measures, or building management changes, use measurement and verification (M&V) in Smart Analytics to validate results. Roll verified savings into Utility Management, so leadership sees the impact in monthly variance and GL reports.
Feed the same meter and billing data to Carbon Hub to calculate Scope 1, 2, and 3 greenhouse gas metrics. Align energy, cost, and emissions in one platform for clean executive summaries, reporting compliance, and portfolio reviews.
A BEMS plugs into your existing workflows, giving you one place to monitor, fix, and prove results without spreadsheet gymnastics. Next up, we will break down the key BEMS components and the KPIs that matter most to your org.
A building energy management system (BEMS) and a building management system (BMS) serve distinct roles that complement each other. The BMS focuses on control by keeping HVAC, lighting, and life safety systems running to maintain comfort and uptime. Meanwhile, a BEMS focuses on insights, turning meter and billing data into trends, KPIs, and verified savings that are tied to budgets and goals.
Your BEMS uses analytics to catch expensive billing errors, make meaningful comparisons, and flag waste, then operators can adjust schedules and setpoints in the BMS to address root causes. Verify improvements with M&V in the BEMS and reflect results in monthly variance and GL reports.
Where BEMS and BMS differ:
Pro tip: Lead with BEMS insights to quantify savings opportunities and build the business case. Then refine BMS setpoints and schedules to capture and sustain those savings without compromising comfort.
Before chasing dashboards, make sure the foundation is solid. A building energy monitoring system works only as well as its integrations, data flow, and analysis. Get the plumbing right—what you measure, how often, and where it lands—and your analytics will be faster, cleaner, and more trustworthy.

Pro tip: Design for change. Buildings evolve, tenants turn over, and equipment gets replaced; a flexible data tree and clear naming standards will save you hours later.
KPIs focus your team on what matters now. Start by choosing a handful that connect daily operations to budget results, then review them at a set cadence. Insight: pair each KPI with an owner and a threshold. When a metric crosses that line, the next action is already defined—no debate, just follow-through.
Tip: Start with 5–7 KPIs tied to your objectives, review them weekly in a Powerview, and expand only when your team consistently acts on what it sees.
Cutting energy use starts with visibility, then moves quickly to targeted fixes you can verify. A BEMS gives you the timeline, context, and proof to turn “we think” into “we know.” It also ties day-to-day operations to budget results, helping you prioritize changes that cut costs without sacrificing comfort. Here are a few simple playbook techniques that work for most portfolios.
Start with interval trends to spot after-hours use, weekend drift, and unusual baseloads. Compare buildings by Energy Use Intensity and Cost/Area to surface outliers, then drill down to the meter or submeter. Use alerts to catch spikes the same day, not after the monthly bill arrives.
Focus on low-cost operational fixes that your BEMS surfaces, like off-hours drift, unexpected baseload jumps, and leaks. Submeter data helps isolate the source to a floor, tenant, or system, so you can act quickly—closing a valve, repairing a stuck flush valve, or fixing a failed steam trap—before it becomes a surprise bill. Once leaks are handled, tighten schedules, stagger starts to reduce peaks, and correct failed sensors that cause short cycling.
Use the BEMS to watch demand ramps and shape loads around your utility’s demand window. Strategies include soft starts in the morning, pre-cooling or pre-heating when conditions allow, and avoiding coincident peaks across large air handlers or chillers. Pair these with automated alerts when demand occurs outside of expected usage or hours.
Create a baseline with weather normalization, apply your change, and let the BEMS calculate energy and dollar savings. Use industry-standard IPMVP modeling so leadership is confident. See verified results in EnergyCAP Utility Management to reflect savings in monthly variance and GL reports.
Publish a small set of KPIs with owners and thresholds. Review them at a set cadence: weekly for problem sites, monthly for the rest. When a metric drifts, your playbook triggers the next step: investigate, fix, verify, and update the Powerview.
Getting started should not require rebuilding your tech stack, just a clear plan and energy management tools that fit your workflow. The objective is a stable, scalable foundation that delivers quick wins in weeks and keeps paying off as you expand to more buildings.
Focus on clean data, simple governance, and measurement and verification from day one so you can show progress to operations and finance without extra spreadsheets.
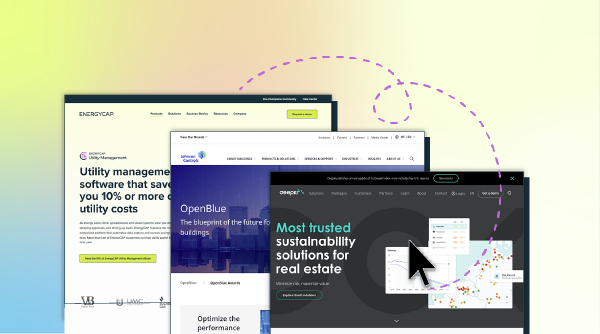
Pro Tip: Not sure which software platforms to explore? Check our guide on the top energy management companies.
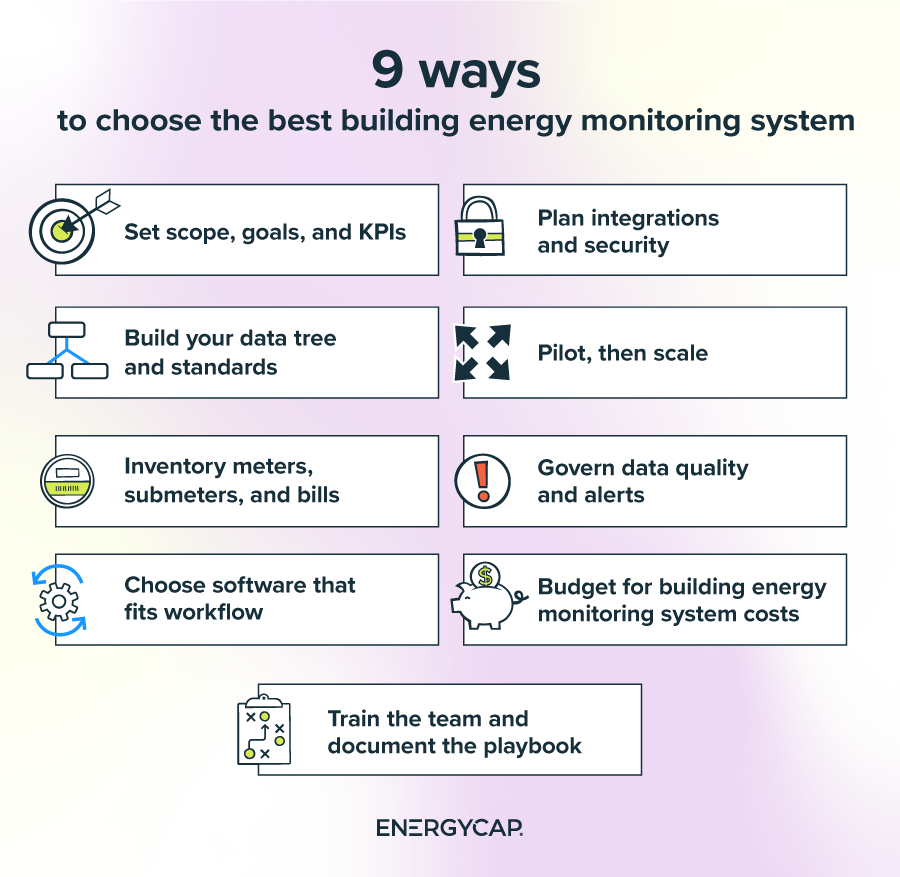
Even strong teams hit friction when they roll out building energy monitoring across multiple sites. The good news: most hurdles are predictable and solvable with a clear plan, a clean data model, and steady follow-through. Use these five solutions to keep momentum and show results early.
Solution: Start with a clean organization hierarchy (data tree) and standard naming for portfolios, buildings, and meters. Validate time zones and units at the source, and set rules for gaps and spikes so bad data never reaches reports. Connect utility bills to Utility Management for verified monthly cost and use and stream intervals to Smart Analytics.
Solution: Prioritize submeters for the largest, most variable loads like tenants, data rooms, kitchens, chillers, and process equipment. Use temporary logging to justify the installation of permanent meters. Phase hardware in waves and pair each wave with a savings target verified by M&V.
Solution: Limit alerts to conditions with cost or comfort impact, such as unexpected after-hours use or demand thresholds. Group related faults, suppress duplicates, and set escalation paths. Review the alert list monthly: retire what no one uses, tune thresholds, and add a short ‘when X, do Y’ response in the alert description.
Solution: Pair every investigation with an M&V plan: baseline window, measurement period, and the savings method. After a fix, publish the verified kWh, therm, and dollar impacts, then reflect them in monthly variance reports. This closes the loop for leadership: what was wrong, what changed, and how it affected the budget.
Solution: Engage IT early with a simple architecture: read-only data flows, encrypted transport, and role-based access. Document data sources, ports, and update policies. Use APIs or secure gateways for BACnet/IP and Modbus TCP, and avoid one-off connections that are hard to support. Review access quarterly and remove unused accounts.
Building energy monitoring pays off when it connects daily operations to budget results. With a BEMS approach grounded in clean data, focused KPIs, submeter insights, FDD, and routine M&V, you can find waste quickly, fix what matters, and verify savings across your portfolio.
See how EnergyCAP Utility Management, Smart Analytics, and Carbon Hub come together to deliver one platform for bills, meters, analytics, and greenhouse gas reporting. Request an EnergyCAP demo to explore real dashboards, review metering options, and map a fast pilot that proves results in weeks.
Energy and facility managers seeking key sensors and meters should start with utility revenue meters for whole-building totals, then add submeters and sensors where they improve decisions.
Sensors and meters used in BEMS:
To efficiently implement submetering in a commercial building, think “prioritize, prove, then scale.” Use this sequence to get started:
To find the best energy management software for building energy monitoring, look for a platform that unifies bills, meters, and submeters, analytics, and M&V. This way, you can move from finding issues to proving savings without exporting to spreadsheets.
EnergyCAP brings this together with Utility Management (bills, usage, GL rollups), Smart Analytics (interval monitoring, alerts, and M&V), and Carbon Hub (greenhouse gas metrics).
To calculate ROI for energy monitoring installations, build a simple model before you buy hardware. Define costs, estimate benefits, and verify with M&V after deployment.
Costs (Year 0 and ongoing)
Annual benefits (verified after go-live)
Core metrics
Pro tip: Define the baseline window and savings method up front, then book verified results in EnergyCAP Utility Management so monthly variance and GL reports reflect the impact.