


As sustainability reporting becomes more common, organizations are increasingly asked to measure and disclose their greenhouse gas (GHG) emissions. Whether driven by regulatory requirements, E...


Headquarters
EnergyCAP, LLC
360 Discovery Drive
Boalsburg, PA 16827
Denver, CO
Suite 500
5445 DTC Parkway
Greenwood Village, CO 80111
Dublin, Ireland
Unit F, The Digital Court, Rainsford Street,
Dublin 8, D08 R2YP, Ireland
Phone: 877.327.3702
Fax: 719.623.0577

As sustainability reporting becomes more common, organizations are increasingly asked to measure and disclose their greenhouse gas (GHG) emissions. Whether driven by regulatory requirements, ESG reporting frameworks, or corporate climate commitments, understanding emissions is now a core part of energy management.
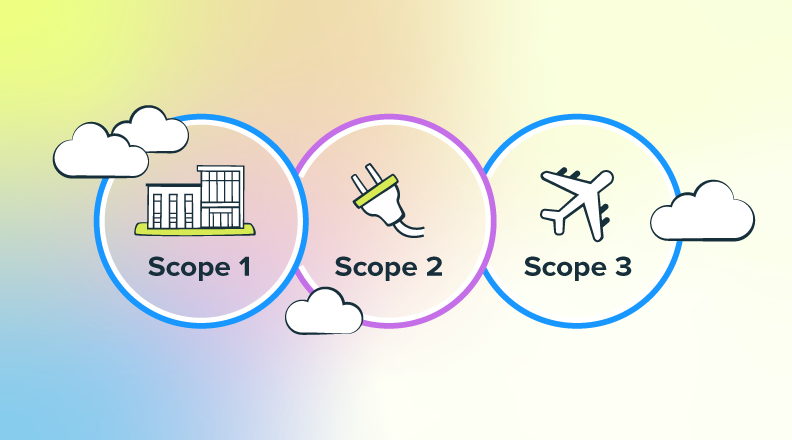
One of the most widely used frameworks for emissions accounting comes from the Greenhouse Gas Protocol and EPA guidance outline standard which categorizes emissions into Scope 1, Scope 2, and Scope 3. These categories help organizations understand where emissions originate and align their efforts with industry-recognized practices.
For energy managers, sustainability leaders, and finance teams alike, understanding these scopes is essential. When your energy and utility data is centralized and analyzed effectively, it becomes the foundation to control costs and reduce emissions at the same time.
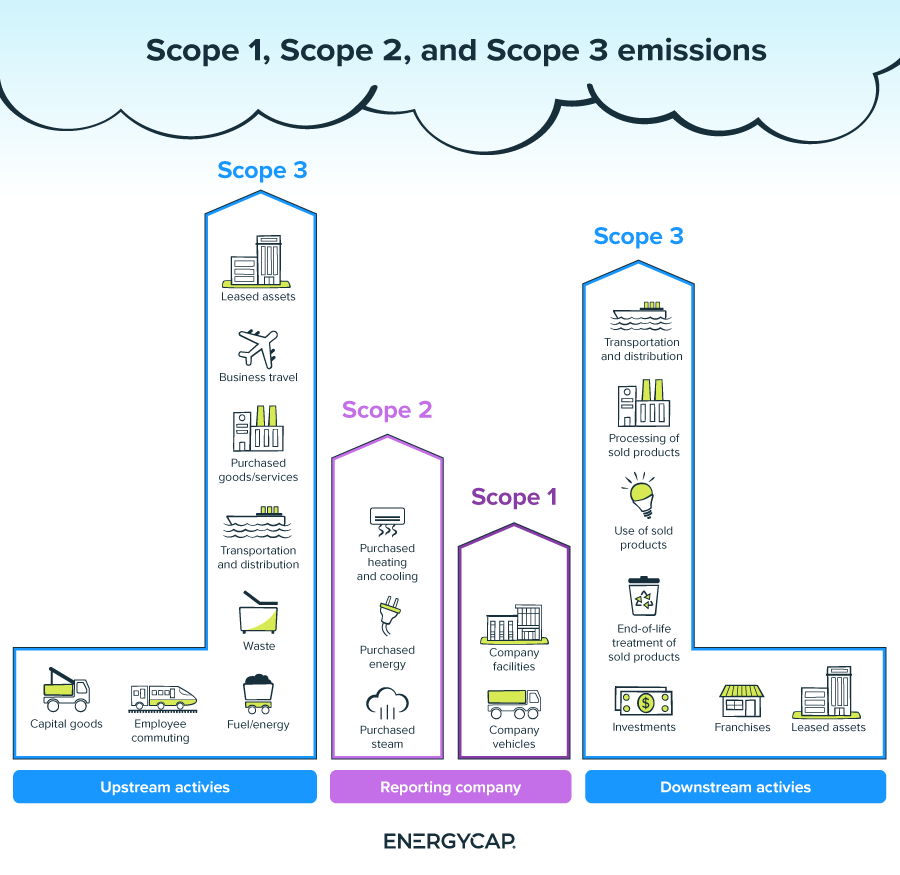
Scope 1 emissions are direct greenhouse gas emissions from sources that an organization owns or controls. These emissions occur from activities happening inside the organization’s operational boundary.
Common examples of Scope 1 emissions:
For example, a university campus burning natural gas to heat buildings, or a manufacturing facility running diesel-powered equipment would generate Scope 1 emissions.
Organizations can reduce Scope 1 emissions by focusing on operational improvements and technology upgrades, such as:
Energy managers often begin by analyzing utility data to identify inefficient systems or buildings with unusually high energy consumption. This aligns with the core principles of energy management including monitoring and optimizing consumption to reduce both costs and environmental impact.
Tracking Scope 1 emissions is often difficult when fuel use varies across facilities, equipment data is incomplete, and refrigerant leaks are inconsistently measured. EnergyCAP brings that data together in one place, so teams can track onsite fuel use and emissions, uncover waste, and manage costs with greater confidence.
Scope 2 emissions are indirect emissions from the generation of purchased energy, primarily electricity, but also steam, heating, or cooling purchased from utilities.
Although these emissions occur at the power plant, they are attributed to the organization consuming the electricity.
Common examples of Scope 2 emissions:
For many organizations, especially large campuses, hospitals, or commercial portfolios, electricity consumption represents a major portion of their carbon footprint. Energy consumption also represents one of the largest operational expenses for most facilities, often ranking just behind personnel costs in organizational budgets. Reducing Scope 2 emissions typically focuses on lowering electricity consumption and shifting to cleaner energy sources.
Common strategies include:
Energy managers often begin with the basics: understanding utility bills, tracking consumption trends, and benchmarking facilities to identify high-energy-use buildings.
Scope 2 emissions are easier to measure than other scopes, but still present challenges due to complex utility bills across multiple facilities, different electricity emission factors by region, changing electricity generation mixes, and Time-of-Use and demand charges complicating analysis. Organizations with dozens or hundreds of utility accounts often struggle to maintain accurate energy records without a centralized system.
EnergyCAP does more than convert purchased energy data into Scope 2 emissions for consistent, defensible reporting. We’re the industry leader in utility bill management, helping customers uncover savings, reduce usage, and control costs at scale.
If California reporting is on the radar for your organization, make sure that you know everything about the state’s climate accountability laws: SB 261 and SB 253.
Learn about California's climate accountability lawsScope 3 emissions include all other indirect emissions across an organization’s value chain. These emissions occur outside the organization’s direct control but are still associated with its activities. Scope 3 is typically the largest and most difficult category to track.
Common examples of Scope 3 emissions:
For many organizations, Scope 3 emissions account for more than 70–90% of total emissions, especially in sectors like manufacturing, retail, and technology.
Reducing Scope 3 emissions requires collaboration across an organization’s supply chain. This can be done by working with suppliers to reduce emissions, purchasing lower-carbon materials, encouraging remote work or sustainable commuting, optimizing logistics and transportation and/or designing products with lower lifecycle emissions. Unlike Scope 1 and Scope 2, these reductions often require cooperation with external partners.
Scope 3 is the most difficult emissions category to measure due to limited data from suppliers, complex supply chains, estimating emissions from purchased goods, inconsistent reporting methodologies, and reliance on industry averages instead of real data. Because of these complexities, many organizations initially focus on Scope 1 and Scope 2 emissions before expanding their reporting efforts.
EnergyCAP supports Scope 3 carbon accounting by converting acitivity, supplier, and operational data into emissions results, so you can organize and report what you know today. It builds a repeatable process that grows with you as supplier and activity data becomes available.
When calculating Scope 2 emissions, organizations can use two different accounting methods: location-based and market-based emissions factors. Understanding the difference between these approaches is important for accurate sustainability reporting.
The location-based method calculates emissions using the average emissions intensity of the regional electricity grid. This reflects the actual mix of energy sources—coal, natural gas, nuclear, hydro, wind, and solar—used to generate electricity in a specific geographic region.
For example:
The location-based method reflects the physical reality of the grid where energy is consumed. The market-based method calculates emissions based on the energy purchasing decisions made by the organization. This approach allows organizations to account for cleaner electricity sources they purchase through mechanisms such as:
For example, if a company purchases renewable electricity through a solar PPA, the market-based calculation may show lower emissions even if the regional grid still relies heavily on fossil fuels.
Whether measuring Scope 1 fuel usage, Scope 2 electricity consumption, or Scope 3 supply chain emissions, the common thread is data. Organizations must gather information from:
Without centralized data, emissions tracking becomes time-consuming and error-prone. This is where energy and sustainability platforms like EnergyCAP provide significant value. By centralizing energy and utility data, organizations can monitor consumption, convert usage into emissions, and generate accurate sustainability reports while also identifying opportunities to reduce costs.
In other words, effective energy management is not just about environmental reporting, it’s about making smarter operational decisions.
Scope 1, Scope 2, and Scope 3 emissions provide a structured way for organizations to understand their environmental impact. But understanding emissions is only the first step.
Real progress comes from turning data into action. By centralizing energy and utility data, organizations gain the visibility needed to identify inefficiencies, reduce emissions, and control costs. When facilities teams, finance leaders, and sustainability professionals work from the same reliable dataset, they can align around a common goal: improving operational efficiency while reducing environmental impact.
Because in the end, the most effective sustainability strategy starts with one thing—good data and the insights it provides.