Life has changed, but life—and work—goes on.
And for those whose duties include energy management, conservation, and cost reduction, your work may be more important today than ever before. Any organization with a budget that relies on revenue from taxes, student tuition, product and service sales to customers, hospitality, transportation, or many other sources will most likely experience substantial shortfalls in the coming months. That gives a new urgency to effective management and reduction of utility expenses.
Database Hosting
For starters, you need to have access to your data. If your energy management information system (EMIS) is a vendor-hosted SaaS-type application, you can skip to the next section. For those of you who host your EMIS on-premises, you may already be experiencing the difficulty or impossibility of accessing your data from home. Although you may be able to VPN into your network, the increasing severity of security controls, dual authorization hassles and strict home equipment requirements make it harder than ever to connect and be productive.
Our hosted clients benefit from being able to quickly access their EnergyCAP data from just about any device running a supported modern browser. The cost of vendor or outsourced hosting is less than one-third the cost of typical on-premises hardware and IT support personnel. We recommend that you put “Move to a vendor-hosted application” on your list of cost-reduction proposals.
Energy Management Report Guide
Now’s a good time to take a close look at what you may have missed—your own data, that is. Start by reviewing our Energy Management Report Guide. The Guide provides examples of the types of reports we think you should be reviewing regularly to manage your organization’s energy use in an effective, efficient manner. Take a read through the Report Guide and visualize how each one could help to publicize, communicate, verify, analyze, identify…all great action steps for effective energy management.
EnergyCAP users can access the reports directly. Most reports have extensive filter options that let you customize what you see and how it’s organized. If you use a different EMIS, search the report library for comparable reports.
Business Process Outsourcing (e.g., Utility Bill Data Entry)
Working from home can be chaotic, so when you get the opportunity to sit down and focus on your energy management responsibilities, the last thing you want to do is spend hours manually entering your utility bill data, and that’s assuming you have a process in place to receive your organization’s mail. Outsourcing the data entry—and other time-consuming, repetitive, yet necessary tasks—will save you time and your organization money, and best of all, it will free you up to focus on much higher value tasks.
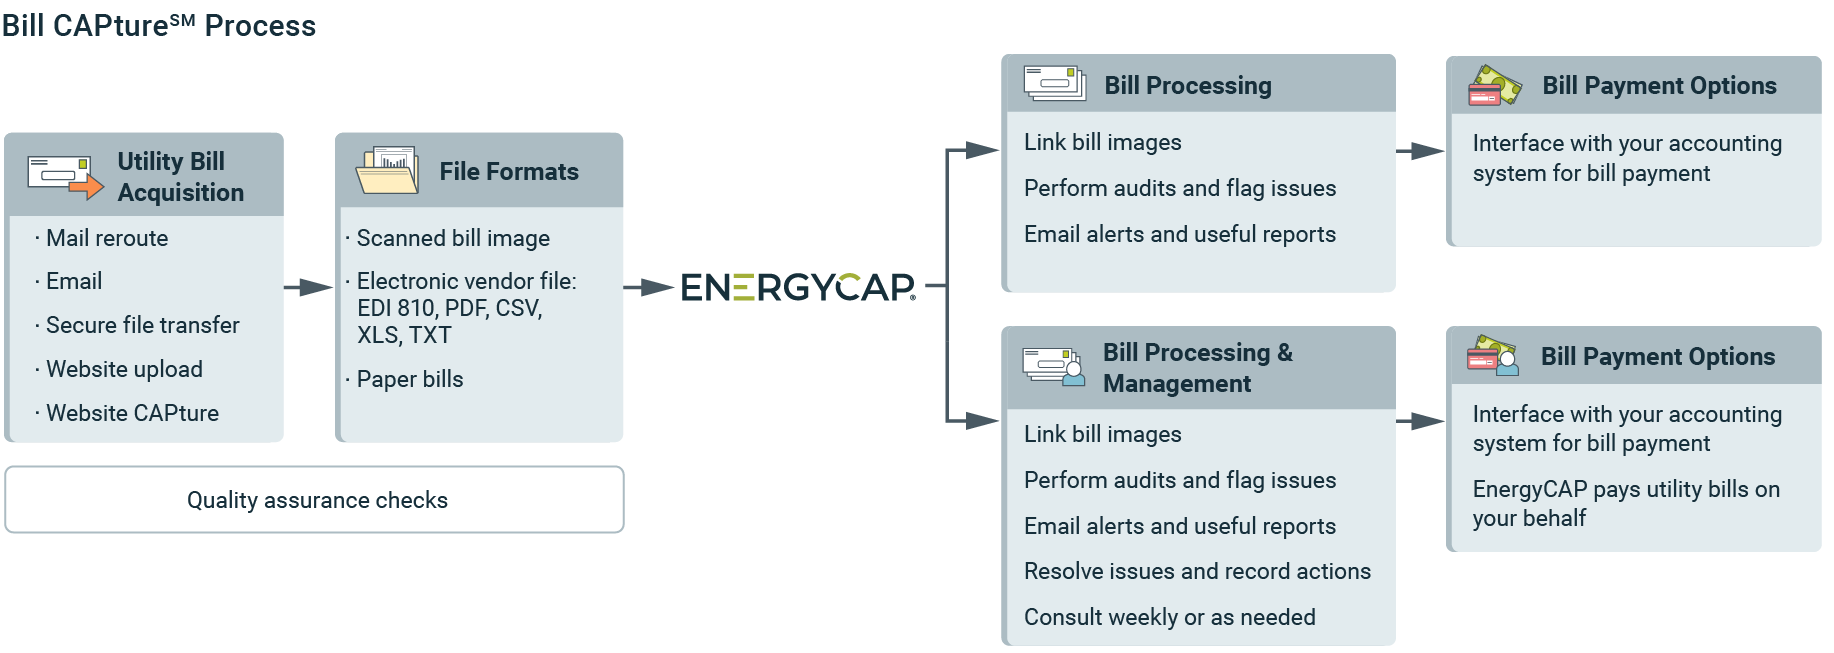
Our Bill CAPture service, for example, takes utility bill entry out of your hands and puts it into our automated workflow. There are various process options and details which are described on our website and illustrated here.
This is particularly relevant today because your ability to receiveand enter utility bills promptly may be severely limited, perhaps even totally delayed until offices re-open. Then what? A huge backlog? Missed payments, late fees, interest charges, service interruptions? It all adds up to extra hassles, added expenses, and unwelcome stress. You’ll wish your future message to your younger self would have been, “Outsource utility bill data entry!”
Thanks to the automated and distributed processing of Bill CAPture, our clients experienced no service interruptions or slowdowns, and all at a “life cycle” cost less than in-house or consultant labor.
Interval Data
You’re an Energy Manager working from home. Your buildings are mainly unoccupied and in shutdown mode, right? A bright side to the crisis is that you’re saving a lot of energy and water.
Or are you? How do you know? Wait a month or two for the utility bills? By then, it’ll be too late. You think and hope your buildings are properly set back or shut down, but without normal occupants or maintenance, custodial, and operations workers there, to say nothing of your occasional walk-throughs, it’s impossible to know for sure.
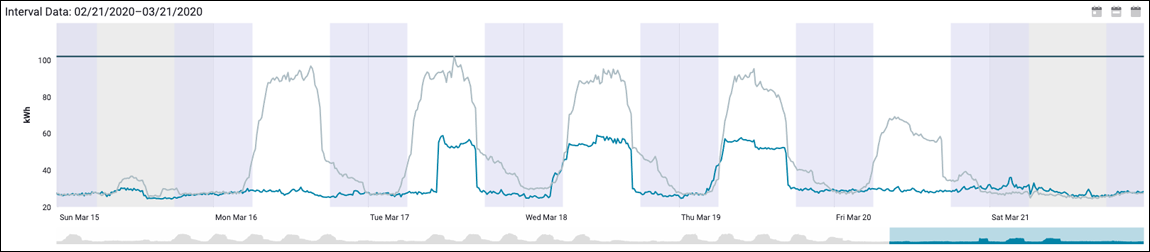
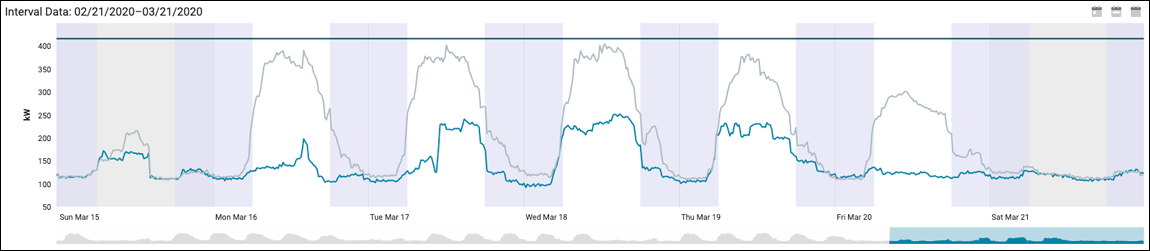
You have no ears and eyes in the building. And that’s where smart meters and interval data play a vital role in conservation and effective building operations. Below are interval data dashboard charts for two high school main electric meters. The gray line is the prior week when school was in session. The blue line is the first Governor-ordered shutdown week. Shaded areas are night times and weekends. White areas are weekdays, 6AM–6PM. As the Energy Manager, do you see anything you wish you had checked?
Here’s one, at High School #1, the March 16 and March 20 daytime shutdowns were terrific, right in line with the weekend shutdown load of a steady 100 kW. But what happened on March 17–19? Someone or something turned on an extra 150 kW for most of the day. High School #2 experienced about the same.
Even though you’re sitting at home, you could have pulled up your data, seen the interval charts in near real time, and immediately investigated (via security cameras, EMS, phone calls) and possibly killed a few hundred unnecessary kWs in just these two schools. And you’re responsible for 50 other buildings, as well. At an average cost of 12 cents/kWh, that’s a daytime savings of about $1.50 per kW of reduction per day. Multiply that by thousands of excess kW and perhaps hundreds of days of planned shutdowns, and the savings quickly climbs into the thousands of dollars.
Instead of sitting at home feeling frustrated by an inability to make a contribution, think of your great sense of accomplishment when you’re able to remotely view the buildings’ “heartbeats” and immediately take action to correct suspected problems…and all while wearing your pajamas.
Benchmarking and Analysis
One good use of your WFH time is to do the benchmarking and analysis tasks that you’ve had on your action list but haven’t gotten around to yet, tasks that some would describe as “not urgent but important.” Sadly, the “tyranny of the urgent” has forced your in-office priorities for years and kept you from addressing the “important.”
You haven’t had the time to go on an energy-saving treasure hunt before, but today’s your day. If you’re like many and find that “eyeballing” problems is your preferred method, here’s your homework:
Assignment #1:
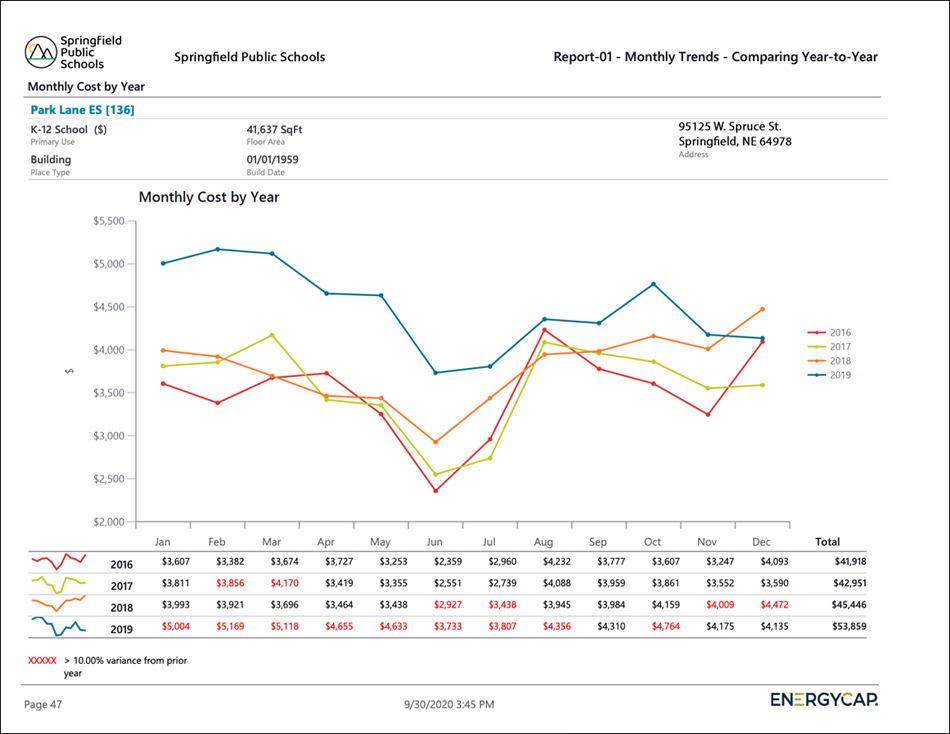
Log in to your EMIS and access the report that compares monthly cost data on a year-to-year basis (Report-01 in EnergyCAP).
Run the report for one commodity, Electric, for example. Re-run the report as desired for each additional commodity.
Set the report to display cost data on a calendarized basis, grouped by building. Ideally, your EMIS will produce one page per building for ease of analysis.
You should look at a few years, maybe the last four or five to get a good comparison of “normal” trends.
Set the “Variance from Prior Year” filter to Greater Than 10.
Generate the report and sit back with your coffee mug in one hand and index finger of the other hand on the Page Down key. You can quickly scroll building-by-building, eyeballing each page and looking for unexpected blips, bumps, and (maybe) boo-boos. You’ll know it when you hear yourself muttering, “Hey, that doesn’t look right.”
Assignment #2:
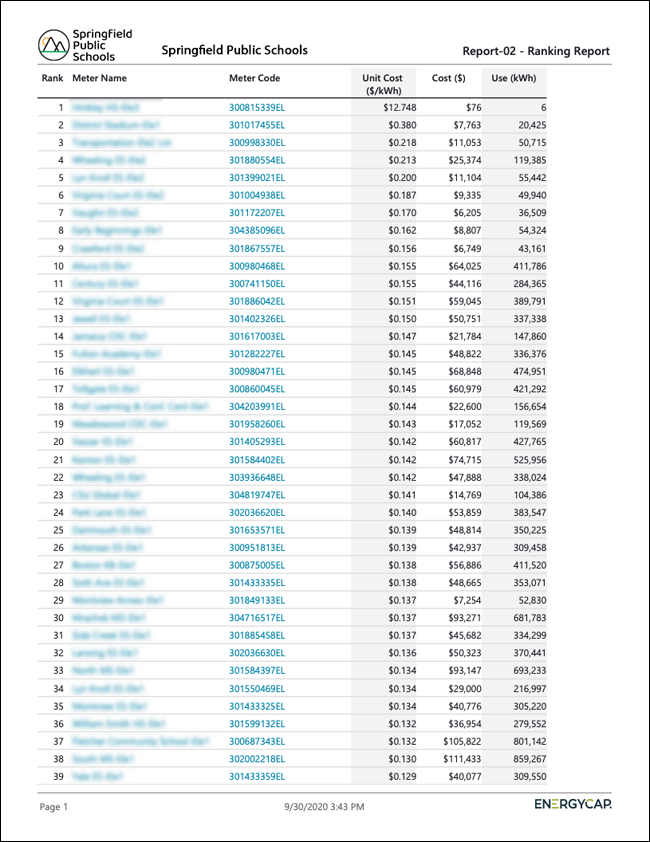
Search your EMIS’ report library for a report that allows you to compare and rank similar objects on a common data type (Report-02 in EnergyCAP).
Select the Calendarized data option and group the data by meter.
Order the data by “Value” ranked by “Unit Cost,” and set the Billing Period to a recent complete 12-month period (2019 is a good choice).
As in the first report, select one commodity(e.g., Electric), and set the Vendor Name to one of your major electric utilities.
Run the report.
Do any of the highest cost per kWh meters also represent a lot of dollars over the span of a year? If so, congratulations. You may have found a great potential cost savings opportunity because this meter may be on a disadvantageous rate schedule or be experiencing some other issue. Click on the meter in the report to drill down to the underlying bills. Happy treasure hunting!
Energy Dashboards
In the “new normal” of impending slashed budgets and highly scrutinized expenditures, you want energy cost reduction to be an organizational priority and a “can’t do without” budget imperative. We all well know the saying “out of sight, out of mind.” Now is a great opportunity to keep energy in sight and top of mind.
One energy reduction strategy that’s been proven through multiple industry studies is that greater visibility leads to greater awareness leads to greater action. That’s why more and more jurisdictions across the U.S. are mandating energy benchmarking and reporting and why many utility vendors provide benchmarking and comparison reports.
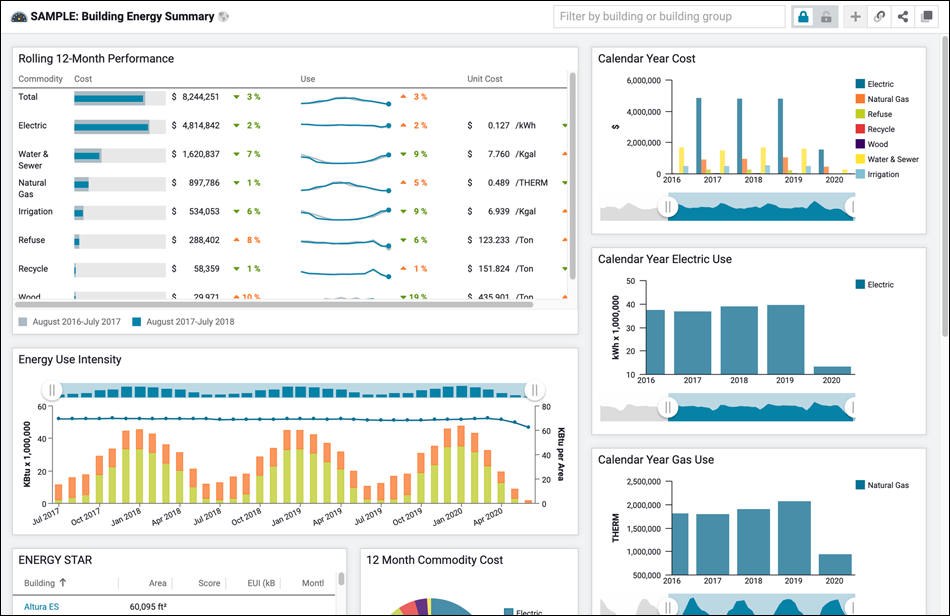
Energy dashboards are an effective tool for communicating an organization’s energy management activities. A dashboard that displays high-level summary data can have broad appeal. It will help to promote energy conservation across your organization, and, if you make it publicly accessible, will inform your customers or constituents about your environmental focus. Dashboards displaying more granular facility-specific energy use and cost data are valuable management tools, providing your energy and sustainability team members with the data they need to make informed decisions.
EnergyCAP provides some sample dashboards, and your EMIS may do the same. Ideally, you’ll be able to start with a sample and then save a copy that you can customize to meet your specific communications or management objectives.
Setting up and sharing energy dashboards is a great leap forward in “democratizing” energy data for easy viewing by everyone.
Summary
As the world changes around us, literally, with each daily news report and government decree, your energy manager world has changed as well. We all need to reduce operating expenses in every way possible, today more than ever.
If you’ve had the time and EMIS access to implement the above recommendations, congratulations! You have used your time at home wisely to become a more effective energy manager. If you’re still digesting the recommendations and have some questions or would like assistance, please contact us. We’re happy to share our 40 years of expertise.
Best wishes for health, safety, and a very successful energy management program.
<?
/******************************************************
TOP BOX HEADLINE
******************************************************/
?>
This website stores cookies on your computer. These cookies are used to collect information about how you interact with our website and allow us to remember you. We use this information in order to improve and customize your browsing experience and for analytics and metrics about our visitors both on this website and other media. For more information, read our Privacy Policy.
Functional
Always active
The technical storage or access is strictly necessary for the legitimate purpose of enabling the use of a specific service explicitly requested by the subscriber or user, or for the sole purpose of carrying out the transmission of a communication over an electronic communications network.
Preferences
The technical storage or access is necessary for the legitimate purpose of storing preferences that are not requested by the subscriber or user.
Statistics
The technical storage or access that is used exclusively for statistical purposes.The technical storage or access that is used exclusively for anonymous statistical purposes. Without a subpoena, voluntary compliance on the part of your Internet Service Provider, or additional records from a third party, information stored or retrieved for this purpose alone cannot usually be used to identify you.
Marketing
The technical storage or access is required to create user profiles to send advertising, or to track the user on a website or across several websites for similar marketing purposes.

 Best-in-class portfolio-level energy and utility bill data management and reporting.
  Real-time energy and sustainability analytics for high-performance, net-zero buildings.
  A holistic view of financial-grade scope 1, 2, and 3 carbon emissions data across your entire business.
  Energy and sustainability benchmarking compliance software designed for utilities.