Welcome to my blog series, #5 of 5, on Effective Energy Management from Home. If you haven’t read Blogs #1, #2, #3, and #4, I recommend you give them a quick read first.
You’re a home-bound Energy Manager. How can you spend your time productively? One good use of your time is to do the benchmarking and analysis tasks that you’ve had on your action list but haven’t gotten around to yet, tasks that some would describe as “not urgent but important.” Sadly, the “tyranny of the urgent” has forced your in-office priorities for years and kept you from addressing the “important.”
Grab a cup of coffee and learn how you can use EnergyCAP benchmarking and reporting tools to spot problems that may be hiding in plain sight. You haven’t had the time to go on an energy-saving treasure hunt before, but today’s your day!
If you’re like me and find that “eyeballing” problems is your preferred method, here’s your homework:
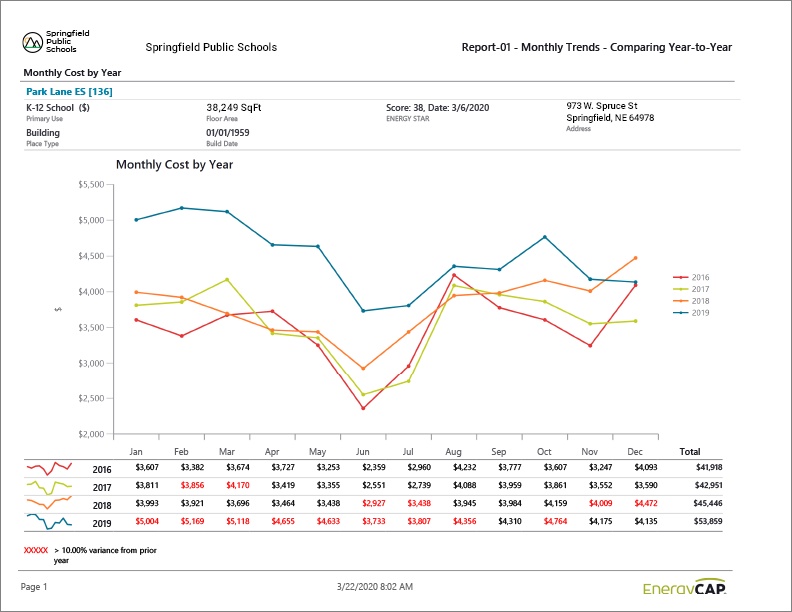
In EnergyCAP Version 7, select Report-01.
Run it, PDF output, once for each Commodity (set Commodity filter to Electric, then run again for Natural Gas, and so on).
Set the Data Displayed filter to “Calendarized”, the Value Displayed filter to “Cost” and the Group Data By filter to “Place Type—Building” which produces one page per building.
Set Billing Period filter to the last few years (if available), perhaps January 2016 to December 2019.
Set the Variance from Prior Year filter to Greater Than 10.
Create the report and sit back with your coffee mug in one hand and index finger of the other hand on the Page Down key. You can quickly scroll down building-by-building, eyeballing each page and looking for unexpected blips, bumps, and (maybe) boo-boos. You’ll know it when you hear yourself muttering, “Hey, that doesn’t look right.”
Here’s assignment #2:
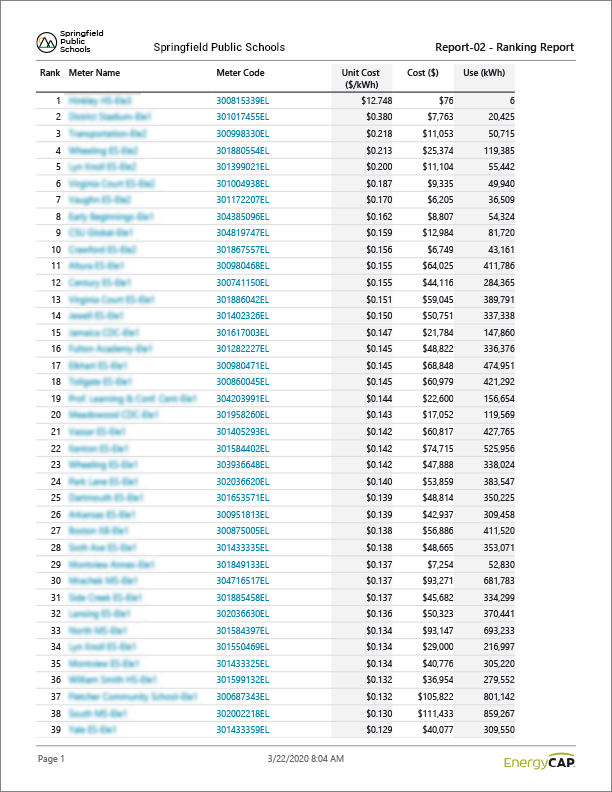
In EnergyCAP Version 7, select Report-02.
Set Data Displayed to “Calendarized,” Group Data By to “Meter,” Order By to “Value,” Rank By to “Unit Cost,” Billing Period to a recent complete 12-month period (2019 is a good choice), Commodity to “Electric,” and Vendor Name to one of your major electric utilities.
Do any of the highest cost per kWh meters also represent a lot of dollars over the span of a year? If so, congratulations. You may have found a great potential cost savings opportunity because this meter may be on a disadvantageous rate schedule or be experiencing some other issue. Click on the meter in the PDF to drill down to the underlying bills in EnergyCAP. You can also view rankings like this in the Groups & Benchmarks module, Meter Groups, Commodity Auto-Group, Cost/Unit.
Happy treasure hunting and stay well! And best wishes that you can use your work-from-home time to become a more effective Energy Manager.
Normal processes disrupted due to work-at-home restrictions? The EnergyCAP team is fully operational and available to help you. Contact us if you need assistance with data entry or management, user training, or other EnergyCAP-related process.
<?
/******************************************************
TOP BOX HEADLINE
******************************************************/
?>
This website stores cookies on your computer. These cookies are used to collect information about how you interact with our website and allow us to remember you. We use this information in order to improve and customize your browsing experience and for analytics and metrics about our visitors both on this website and other media. For more information, read our Privacy Policy.
Functional
Always active
The technical storage or access is strictly necessary for the legitimate purpose of enabling the use of a specific service explicitly requested by the subscriber or user, or for the sole purpose of carrying out the transmission of a communication over an electronic communications network.
Preferences
The technical storage or access is necessary for the legitimate purpose of storing preferences that are not requested by the subscriber or user.
Statistics
The technical storage or access that is used exclusively for statistical purposes.The technical storage or access that is used exclusively for anonymous statistical purposes. Without a subpoena, voluntary compliance on the part of your Internet Service Provider, or additional records from a third party, information stored or retrieved for this purpose alone cannot usually be used to identify you.
Marketing
The technical storage or access is required to create user profiles to send advertising, or to track the user on a website or across several websites for similar marketing purposes.

 Best-in-class portfolio-level energy and utility bill data management and reporting.
  Real-time energy and sustainability analytics for high-performance, net-zero buildings.
  A holistic view of financial-grade scope 1, 2, and 3 carbon emissions data across your entire business.
  Energy and sustainability benchmarking compliance software designed for utilities.