


For most organizations, energy and utility costs sit quietly in the background; processed, paid, and filed away as a routine operating expense. But that mindset is becoming increasingly risky....


Headquarters
EnergyCAP, LLC
360 Discovery Drive
Boalsburg, PA 16827
Denver, CO
Suite 500
5445 DTC Parkway
Greenwood Village, CO 80111
Dublin, Ireland
Unit F, The Digital Court, Rainsford Street,
Dublin 8, D08 R2YP, Ireland
Phone: 877.327.3702
Fax: 719.623.0577
Grocery stores are energy hogs, using more energy for refrigeration than any other industry in the country. But the problem isn’t just high usage, it’s hidden waste that’s buried in utility bills, override switches, outdated Building Automation System (BAS) schedules, and misaligned capital priorities.
It’s the cooler that drifts 3°F off the setpoint for weeks before someone notices. It’s HVAC units short-cycling on 95-degree days because someone overrode the economizer logic last July. It’s $20,000 in peak demand charges you couldn’t avoid because no one saw the spike coming. And the worst part? You’re probably paying for it across hundreds of locations.
If you manage energy or facilities for a grocery chain, you already know that solving these problems isn’t just about cutting kWh; it’s about protecting margin, planning smarter capital projects, and keeping stores operational while minimizing the work efforts of your facilities and operations team.
Let’s talk about how to fix it.
There’s no shortage of flashy energy ideas: rooftop solar, LED retrofits, even sophisticated building automation controls. But most grocery stores are leaking energy, and money, in much more mundane ways:
None of these factors show up in your monthly variance report. They don’t trigger alarms. But they’re there, straining your budget one kWh at a time.
The key to stopping hidden waste is using the utility data you already have. Interval data (from smart meters or AMI feeds) shows you when load starts to drift, which stores spike during shoulder hours, and which sites keep low baseloads all night long. When paired with your building metadata like square footage, system types, BAS installs, and weather zone. Combined, these data points can answer essential questions:
A great place to start is gathering your monthly billing data, ongoing emissions tracking, and interval data together. But here’s the catch: utility data is messy, fragmented, and hard to use unless you’ve got the right system in place. And if that place is a spreadsheet, it’s extremely difficult to get meaningful insights from the information you have.
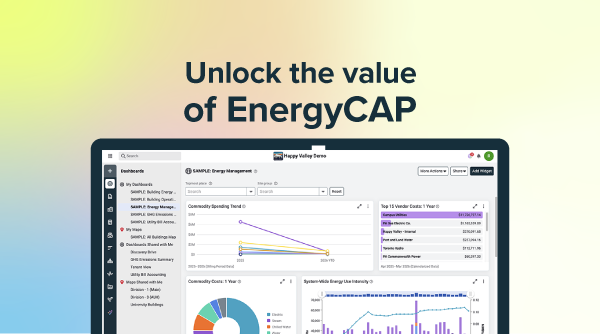
This is where advanced energy management software (EMS) comes in. EnergyCAP Utility Management takes the utility data you’re already collecting and turns it into a decision-making tool for both finance and facilities. EnergyCAP allows for:
If you’re in finance, you’re already watching margin erosion from inflation, consumer changes, and inventory shrink. Energy might feel like a fixed cost, but it’s not. Hidden waste is a controllable cost once you have visibility.
If you’re on the facilities or energy team, you need better tools. You could be sitting on years of utility data that will help you run leaner, catch issues faster, and plan smarter. But you need to centralize and visualize it in a useful way.
Together, you should be asking:
If your current systems can’t answer those questions, EnergyCAP can.
Hidden waste is eating your grocery margins: drifted setpoints, overrides, and poor sequencing that go undetected. Use interval data alongside bills and emissions in one system to spot issues fast, control demand charges, and prioritize projects that bring down your utility bills.
Start by gathering 12–24 months of your utility bills, and use our free benchmarking calculator to see how your buildings compare to other grocery retail portfolios, compare your buildings against each other, and understand your Energy Use Intensity. Then, give us a call to start your journey to lower utility bills.
Try our simple, no-login-required tool to help you quickly assess your building’s energy performance and start identifying opportunities to cut costs and reduce emissions.
Try our free benchmarking tool