Energy benchmarking is a way of deriving value from your available energy data by comparing the performance of multiple peer group members. It’s a way of determining how a place, building, or meter ranks in comparison with similar places, buildings or meters.
Benchmarking can deliver significant payback if it’s done right. Here are four keys to effective energy benchmarking. We’ll use EnergyCAP benchmarking charts for examples.
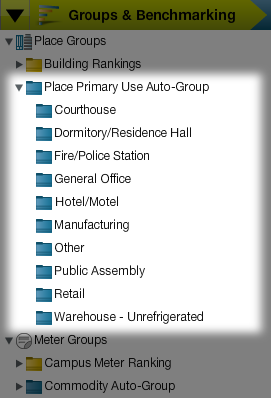
Key 1: Define Closely-Matched Peer Groups
The first key is to define closely-matched peer groups. It doesn’t make any sense to benchmark a fire station with a library, even if they were built in the same year. The example below demonstrates a thoughtful approach to benchmarking municipal buildings based on building types and functions.
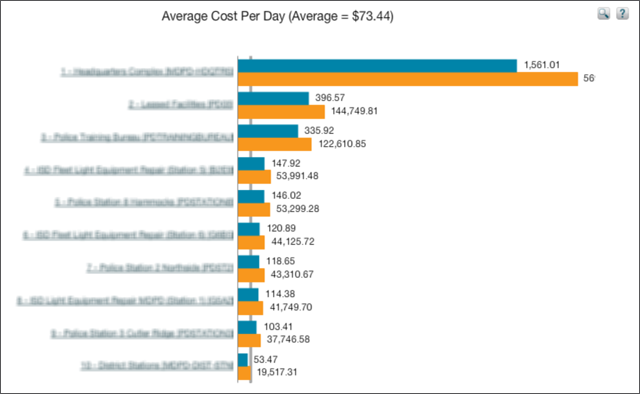
Key 2: Prioritize Benchmarking Efforts
A second key is to prioritize benchmarking efforts based on the probable return for your investment of time and money. The following example displays building average costs per day. The blue bars indicate the average daily cost for each included building. The associated orange bars represent the total cost for the whole year for the same buildings.
As you might expect, the buildings that cost the most per day on average, also cost the most for the whole year. This particular comparison does not suggest a specific problem with a specific building, but it does answer a very specific question: “What are my ten most expensive buildings?” And this can be an important question to answer when considering energy management project alternatives. Benchmarking data answers that question very quickly and definitively.
Key 3: Use Correct Benchmark Metrics
The third key is to use benchmark metrics most likely to reveal energy issues. We could create a peer group for brick buildings and another peer group for steel and glass buildings, but we might quickly discover that external construction materials are not a very helpful or actionable indicator of energy efficiency. Building primary use (school, firehouse, dormitory, etc.) is a much more reliable energy benchmarking metric for a peer group.
Key 4: Filter Out the Noise
A final key to effective benchmarking is to filter out the noise in your benchmarking process. A good benchmarking system is one that allows you to quickly focus on the opportunities that offer the greatest return on your investment.
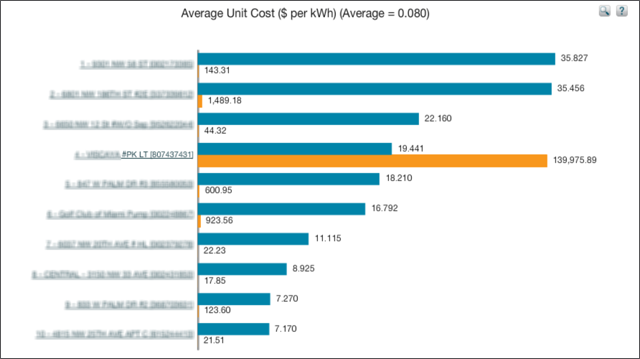
This next chart is a simple unit cost analysis. The chart is ranking each included meter by unit cost.
The unit cost (blue bar) for the worst meter has been calculated at a shocking $35/kWh. But when we look at total cost (orange bar), we see that we have only spent $143 all year. It’s simply not worth our attention. So it’s helpful to find a benchmarking system where it’s easy to separate the wheat from the chaff—to quickly recognize and exclude places and meters that do not offer a significant energy management ROI.
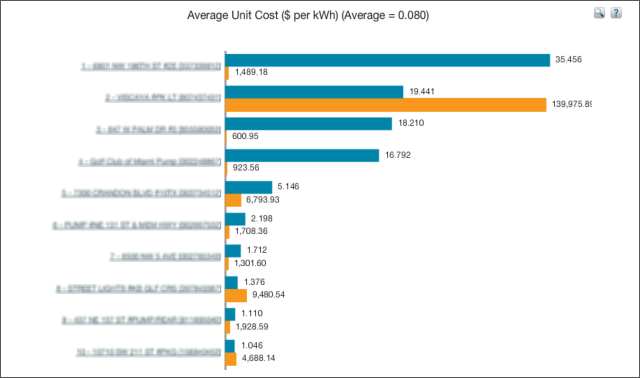
EnergyCAP benchmarking reports can be configured to throw out some of these small meters, perhaps the ones that are $100, less. By only displaying the higher-use meters, we now have a much more useful chart:
The average unit cost for the worst meter, at $35.00 per kilowatt hour, is terribly high. And this meter cost about $1,500 last year–well worth taking a look at.
The number two meter, at $19 per kilowatt hour, is also far too expensive, and this meter costs about $140,000. That meter should be a high energy management priority. Something unusual is happening there. It could be some kind of park lighting account–perhaps a specially-negotiated rate that might include the rental of lights.
Outdoor recreational lighting has very poor load factors and high demand rates. There could be several reasons for the unusual unit cost, but because of the very significant expense, it would be important to follow up. The unit cost for meter five is $5 per kilowatt hour, and spending was about $6,700 per year, so there is another issue worthy of follow-up.
The potential savings from these recent examples could add up to more than $170,000 annually, so it’s easy to see the potential payback for benchmarking. Happy Benchmarking!
{{cta(’38a0c2ad-b307-454e-8129-f232703b9ac0′)}}
<?
/******************************************************
TOP BOX HEADLINE
******************************************************/
?>
This website stores cookies on your computer. These cookies are used to collect information about how you interact with our website and allow us to remember you. We use this information in order to improve and customize your browsing experience and for analytics and metrics about our visitors both on this website and other media. For more information, read our Privacy Policy.
Functional
Always active
The technical storage or access is strictly necessary for the legitimate purpose of enabling the use of a specific service explicitly requested by the subscriber or user, or for the sole purpose of carrying out the transmission of a communication over an electronic communications network.
Preferences
The technical storage or access is necessary for the legitimate purpose of storing preferences that are not requested by the subscriber or user.
Statistics
The technical storage or access that is used exclusively for statistical purposes.The technical storage or access that is used exclusively for anonymous statistical purposes. Without a subpoena, voluntary compliance on the part of your Internet Service Provider, or additional records from a third party, information stored or retrieved for this purpose alone cannot usually be used to identify you.
Marketing
The technical storage or access is required to create user profiles to send advertising, or to track the user on a website or across several websites for similar marketing purposes.

 Best-in-class portfolio-level energy and utility bill data management and reporting.
  Real-time energy and sustainability analytics for high-performance, net-zero buildings.
  A holistic view of financial-grade scope 1, 2, and 3 carbon emissions data across your entire business.
  Energy and sustainability benchmarking compliance software designed for utilities.