


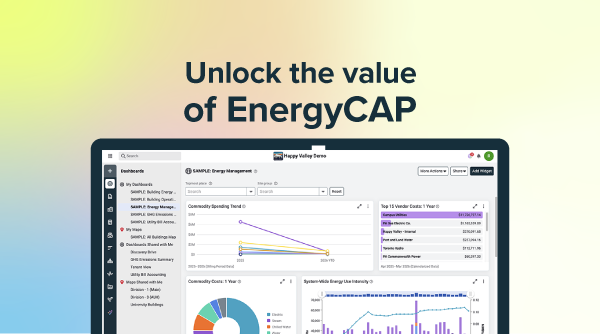
Getting the most value out of EnergyCAP starts with your energy culture. Regardless of the tools you use, building a disciplined, data-driven energy management strategy connects people, proces...


Headquarters
EnergyCAP, LLC
360 Discovery Drive
Boalsburg, PA 16827
Denver, CO
Suite 500
5445 DTC Parkway
Greenwood Village, CO 80111
Dublin, Ireland
Unit F, The Digital Court, Rainsford Street,
Dublin 8, D08 R2YP, Ireland
Phone: 877.327.3702
Fax: 719.623.0577
This eBook is most relevant for energy managers and other organization energy stakeholders tasked with review and analysis of utility billing information. A working knowledge of utility bill formats and rate schedules is helpful but not necessary. This eBook presents six valuable utility bill auditing tips—suggestions that will help as you go through your normal utility bill review, approval, and payment process every month. These tips will help you spot problems and save money in the process!
Why are bills estimated? Frankly, the primary reason is simply the convenience of the vendor. If the vendor estimates your bill every other month and reads it every other month, they only have to read it half as much. That can translate to big savings in labor, which can benefit both the producer and the consumer.
However, there are other reasons a bill might be estimated—and they’re problematic. Sometimes a bill is estimated because the meter is faulty, or the meter reading is incorrectly keyed by the meter reader. So when the faulty meter reading is identified through the utility provider’s analysis, the bill is then estimated, since it is the best the provider can do with the available information.
More commonly, a bill is estimated because the meter reader is unable to gain access to the meter location. In this case, it is important for the utility customer to determine why the meter reader lacks access. Perhaps a required key is unavailable, or the lock has been changed. Perhaps the meter has been vandalized.
Our EnergyCAP clients have discovered cases where the building where the meter resides is literally vacant, the property is secured, and the meter reader can’t get in to read the meter. Often in these cases, the meter reader doesn’t realize the building is vacant, so he/she simply keys “No Access to Meter” and moves on to the next meter.
Meanwhile, back at headquarters, the utility company estimates the bill using previous utility bills as a guide, not realizing the building is vacant and using almost no energy. This can be a costly scenario for the utility customer!
When the bills are estimated, the estimates are usually based on historical data. However, estimates are often high. Large numbers of estimated bills can result in significant overpayments, at least over the short term. A large government organization in Florida recently reviewed their electricity bills and discovered that eight percent of all of their utility bills were being routinely estimated.
As a result, they cracked down on the vendor. They went back to the vendor in every single case, asking, “Why is this one estimated?” and “Why is that one estimated?” And they put some pressure on the vendor to take care of whatever condition it was that was causing them to have to estimate the bills.
If an expensive account is being estimated multiple months in a row, that should be a red flag for the energy manager. You probably don’t need to be concerned with a $50.00/month bill that is being repeatedly estimated, but when you have a $5,000 or $10,000 bill that has been estimated two months in a row or more, that bill should command attention. It’s very likely that you are paying more than you should be paying.
With kWh readings, an estimated reading can be “trued up” with the next regular meter reading. But when a demand estimate is involved, there is really no way to “true up” the demand. You are just trusting the utility company if you don’t call them to task about it. But you can’t raise the issue unless you are tracking consistently enough to recognize a potential problem.
Incorrect units of measure will lead to garbage data for analytics and reporting. Some commodities are more challenging than others in this regard. Electricity use is universally expressed in kilowatt hours (kWh). But water and natural gas have multiple units of measure, with non-standard abbreviations.
Plus, there are occasional cases where the vendor won’t even bother to include a unit of measure on the bill. Fortunately, unit-of-measure errors usually become obvious through analysis. Here are several types of problems to look for.
Sometimes more than a single unit of measure may be shown on a bill. That leads to confusion. And often in very large organizations, the people entering utility data into your tracking system may not be looking for the correct unit of measure.
Natural gas is a great example. Natural gas in utility bills can be expressed in therms, dekatherms, millions of BTUs (MMBTUs), hundreds of cubic feet (HCF), even thousands or millions of cubic feet (which may BOTH be abbreviated MCF).
Although electricity around the world is measured in kilowatt hours, there may be additional measures for reactive power or electric demand on the utility bill, including KVAH, KW, KVA, KVAR, and KVAR hours. When multiple units appear on one bill, it can be confusing for data entry staff, especially if they have not been adequately trained.
Make certain that your organization provides appropriate training, and devise an analysis scheme to help ensure that units of measure do not become an issue with your energy database.
Water is a particularly troublesome commodity because there are so many choices, including gallons, thousands of gallons, or hundreds of cubic feet, which can be expressed in CCF (“C” indicating hundreds in the Roman numeral system) or HCF (hundreds of cubic feet). “M” is often used as the Roman numeral for thousand. But some people may assume that “M” means million or mega.
You may have encountered other water units, particularly if you are associated with a multi-site organization that touches many different water authorities. You may discover a wide mix of these units of measure on different bills from different vendors, and it can be quite challenging to compare and benchmark water use across your organization given the disparity in units of measure.
EnergyCAP addresses this issue through the use of “native” (meter-based) and “common” (commodity-based) units of measure. The software performs conversion calculations in the background, enabling commodity use comparisons across the enterprise. Global units of measure (usually MMBTUs) even make it possible to do cross-commodity energy comparisons for larger organizational divisions.
It is surprisingly easy to double-count commodity use. This is because the same use value may appear more than once on a single utility bill. You might find the use reading incorporated in the meter read section of the bill. You might see it again in the cost calculation section of the bill.
You might see it again in the month-to-month summary section of the bill, and you might even see it again in the delivery/generation supply section.
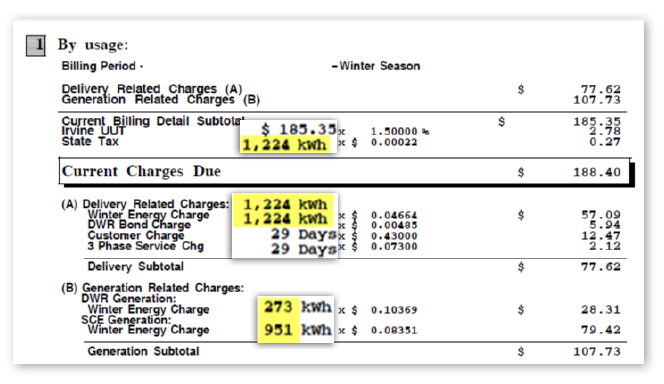
To make things even more confusing, use may be split into different categories. The example below breaks down generation charges for the same kWh of use into two classes, DWR and SCE generation. As you can see, the total kWh use appears in three other places! If you attempt to track every line item on every bill, you may run into problems entering repetitive data into your energy tracking system.
There are various utility bill tracking outsourcers that frequently make this kind of mistake. If/when an outsourcer tells you that “We track every line item,” that may be another way of saying “Our data entry staff doesn’t have the necessary expertise to know what line items to track, so we’re just going to track them all and let the user sort it out.”
For this reason, it may be important for you to establish conventions for reporting of “information only” commodity use, which will not be counted when tallying and reporting total use.
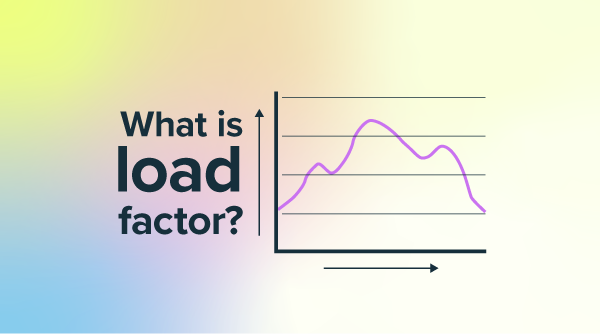
Load factor is an extremely useful calculated value that can help spot data problems, metering problems, rate change opportunities, and mechanical electrical system control problems.
What is load factor? How do we calculate it and how do weuse it?
Simply stated, load factor is the ratio of highest actual kilowatt (kW) demand during the billing period to the maximum theoretical kilowatt hour (kWh) use, if demand remained constant for the entire billing period. The actual electricity use in kWh is what you see on your bill. The electricity demand (in kW) is your “peak load”. The load factor formula is:
Monthly kWh/(monthly peak KW Demand * days in billing period * 24 hours)
For example, imagine that you receive an electric bill that indicates 40,000 kilowatt hours of use, with a peak demand reading of 100 kilowatts. To determine load factor, you would divide the actual use (40,000) by the theoretical maximum use, which is the product of kW demand (100), days in the billing period (30), and 24 hours in the day.
This formula reduces to 40,000/72,000 or .555. Expressed as a percentage, that’s a load factor of about 56 percent. Looking at the month as a whole, the average load was about 56 percent of the maximum load at any given time.
What is the value in monitoring the load factor associated with each of your meters? First of all, let us consider situations where we might expect a very high load factor—where the percentage value is closer to 100 percent.
High load factor is only found in scenarios where a very steady load is present—where energy demand remains constant throughout the billing period. What types of structures or equipment might fit this profile? A data center might. So would a refrigerated warehouse, a supermarket, or an enclosed parking deck with lighting that is on for all hours of the day or night. In situations like that, the actual use is typically very close to the maximum theoretical use because everything is running all the time.
A high load factor profile is important because it might qualify that account/meter for a special low-cost rate. Utility companies appreciate high load factor meters, because demand is predictable, which makes it easier for planning for power generation. If you discover a meter associated with a load factor over 80 or 90 percent, always check to see if the meter is on a rate schedule that will reward you for that.
But what if you notice a very high load factor in some other kind of building, such as an office building, school, retail store, restaurant, or hotel? You might think that this is a good opportunity to benefit with a high-load utility rate. However, the reality may be that the building is being managed inefficiently.
Remember that high load factor is associated with a very steady load, which means there is probably no nighttime or weekend setback for that building/meter. If you had effective nighttime or weekend setbacks, you would not be running at a steady load. Instead, the load would be lower at night and higher during the day. It would be higher during the working week, and generally lower on the weekends.
If you observe a high load factor for a meter associated with a building type that is not commonly associated with higher load factors, your response should be: “Why is the load factor so high? Why aren’t we turning things off at night?” A high load factor is often a sign of building control problems, but may also indicate billing or metering problems. Either way, there may be an opportunity for significant energy savings.
What if your load factor is over 100 percent? This would mean that the actual use was higher than the maximum theoretical demand for that meter, which is impossible. This scenario is an indication of a data entry problem. Always investigate if you discover a load factor reading greater than 100 percent.
What about low load factor—the other side of the spectrum? If the load factor is under 20 percent, what does that mean? It means that you have a very “spiky” load. It means that significant load is being generated but only for a short period of time. Then that equipment turns off. What type of situations would fit this scenario?
An outdoor athletic field is a textbook example (sporadic but intense lighting needs). Another example might be a standby pump, an irrigation pump, or a stormwater ejector pump. This type of equipment operates in high gear, but only occasionally, and for short periods of time.
If you notice a low load factor associated with an office, store, restaurant, or a school, that may be a cause for concern. Inconsistent and widely varying loads are not normal for these facilities. A low load factor often indicates a data problem, meter problem, or billing problem. It may also indicate very oversized equipment for the energy need.
The equipment may generate a very heavy load but only for a short period of time because it’s oversized for the work required. That scenario can also result in expensive long-term demand ratchet penalties. It’s good to know that, especially when it’s time to replace that equipment.
A medium load factor—40 to 60 percent—would be typical for offices, restaurants, schools, and other building types that have nighttime and weekend setbacks. There might be some variation through the year, depending on HVAC needs, but that is what you should expect to see for those types of structures. With the EnergyCAP load factor report, it’s easy to spot load factor problems.
Let’s take a closer look at some load factor examples, using EnergyCAP charts. The first example is a meter associated with outdoor recreation.
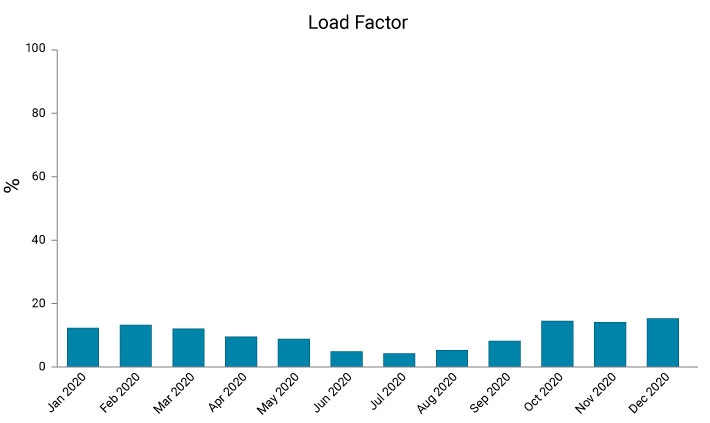
Notice that for every monthly data point, the load factor is below 15 percent. Why might this be? The most likely answer is that the majority of the load is supplied for a significant electric lighting load, which is only required when the field is in use.
But why is the load factor higher in the winter than it is in the summer? This is because in the winter, the lights are on for more hours because there are more hours of darkness. So the actual use, the numerator is a larger number in the winter. It’s still a low number when compared to the maximum theoretical demand, but it’s still a larger number than in the summer, when we see the same demand wattage, but for a shorter period of time since there are more hours of daylight.
This second graph represents the load factor of a data center.
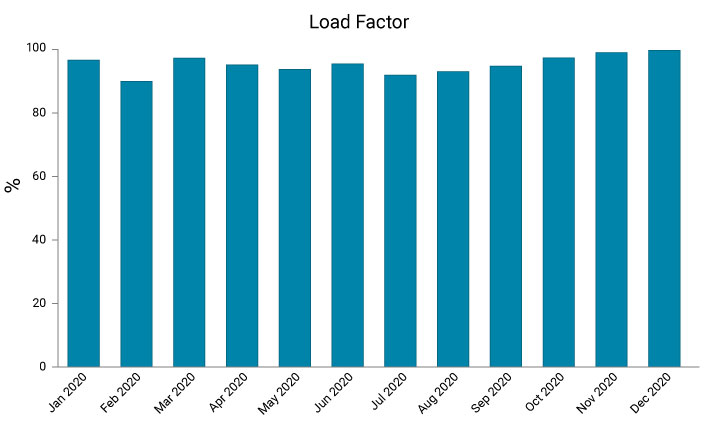
The data center is averaging about 90 percent load factor—very constant throughout the year, as we might expect for a building of this type.
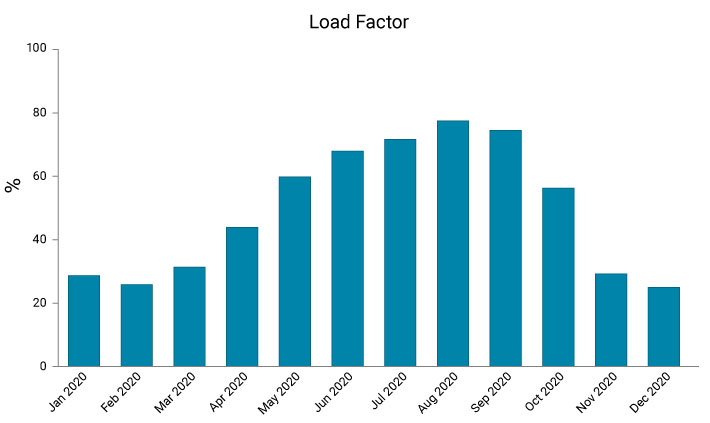
The next example is a public library. With the library, notice that the load factor is higher in the summer than it is in the winter. This happens to be a public library in Florida. A likely explanation is that due to the threat of mold and mildew, library staff probably run the air conditioning nearly all the time in order to control humidity.
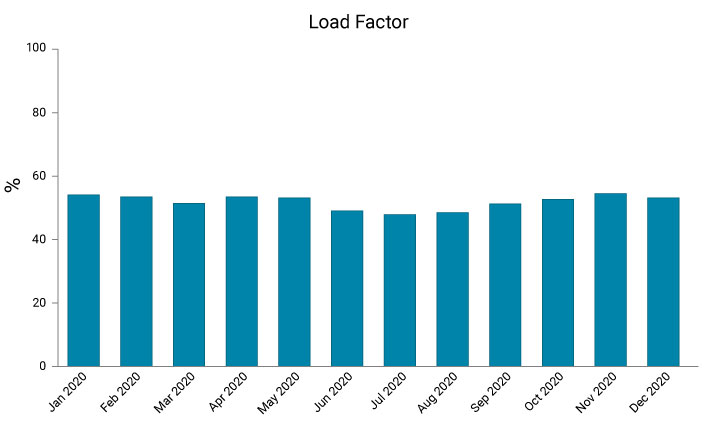
The last example is a typical office building. The load factor is about 50 percent, with minor seasonal variation.
Let’s move on from load factor to power factor. Some people get power factor and load factor confused, or they may use the terms interchangeably. Actually, power factor has nothing at all to do with load factor.
Power factor is a characteristic of alternating current having to do with its magnetic nature. It is the ratio of the real power flowing through a circuit to the apparent power, which is the product of current and voltage. Power factor is expressed as a dimensionless number between -1 and 1.
The lower the number, the higher the loss of effective energy in the electrical system due to operating conditions.
Inductive loads, such as in large motors and transformers, cause a kind of interruption in the wave form that makes up alternating current. And that can create problems for the utility company. Capacitors can be used to correct power factor. Facilities with heavy service electric, including large motors or many transformers or ballasts, may have a low power factor.
Utility rate schedules may impose power factor penalties if the power factor value dips below 0.8 or 0.9 (80–90 percent). This can result in higher costs for industrial/commercial customers. Often, lower power factor is a condition that can be mitigated or corrected. If your utility is assessing power factor penalties, you may want to discuss possibilities with the utility provider and your electrical engineer.
It’s critically important that you understand the rate schedule associated with each meter you are tracking, because there are lots of energy-saving opportunities there. You also need to know what alternative rates are available to you.
Many rates are posted on the U.S. Department of Energy’s Open Energy Information website or on the utility vendor websites. Over 43,000 rates have been contributed for nearly 4,000 EIA-recognized utility companies.