Yes, very unfortunate budget cutbacks loom in the future, but for the next few months your utilities budget will be benefiting from an unexpected stimulus. Facility shutdowns and deep setbacks have slashed utilities consumption for most organizations, and those cost reductions will soon be evident.
In my next blog, we’ll look at some ways you can allocate surplus funds wisely. Today, let’s look at a good way to set utilities budget surplus expectations.
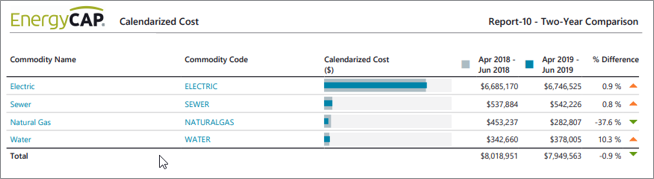
First, we’ll look at historical trends. For many organizations, shutdowns began the third or fourth week of March and will likely continue in full force for two months, and perhaps partially for a third. Utility bills, of course, have scattered start and end dates, so we’ll use calendarized data for the months of April, May and June. Here’s Report-10 with historical data for the second quarter of the year, 2019 over 2018:
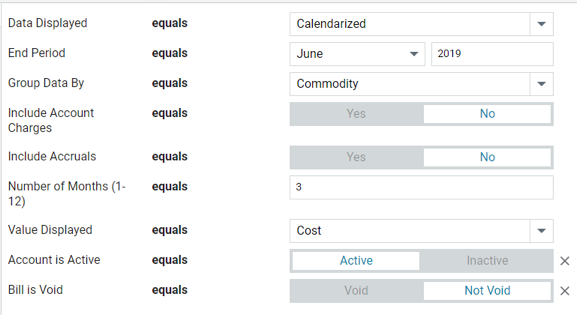
By running this for Q2 for the two prior years, we have a good baseline for the second quarter of the year, about $8 million. Here are the filters that were used:
An interesting side note—Report-10 shows very stable utilities costs year-over-year, except for natural gas. Cost in 2019 plunged 37.6% below 2018. Is this due to a big reduction in use or unit cost, and what can we expect for 2020? A quick re-run of Report-10 for use instead of cost shows that the unit cost remained stable; it was the use that fell 37% in 2019 over 2018. Using WeatherDataDepot.com, I can see that heating degree days in this city in April 2018 were 150% higher than 2019. Conclusion: If the 2020 weather is trending more like 2018, expect higher cost avoidance due to shutdowns, if weather trends are more like the mild April 2019, expect lower cost avoidance.
The next part is a bit subjective, so you may want to use your own savings factors in this worksheet. Important considerations include: Will shutdowns be for a full three months, or closer to two or two and a half? Have shutdowns been deep, or did some energy and water-using activities continue? Will my rates give me the full benefit of shutdowns, or are there minimums, ratchets, etc.?
Commodity
Prior-year Q2 cost
Savings factor
2020 Budget Surplus
Electricy
$6,700,000
x 0.75
$5,025,000
Natural Gas
$350,000
x 0.80
$280,000
Water
$350,000
x 0.90
$315,000
Sewer
$540,000
x 0.90
$486,000
Total
$6,106,000
An unexpected utilities budget surplus of over $6 million!
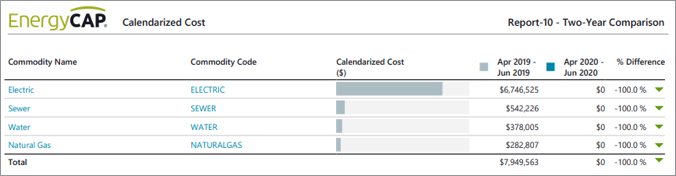
The obvious question is, “I see how you created the estimate, but what’s a good, simple way to track actual cost avoidance?” I recommend running Report-10 periodically to track the actual cost values. Here’s Report-10 as of today, using the same filters as shown above but changing the End Period from 2019 to 2020:
The Apr-Jun 2020 column is empty because those bills have not yet been processed, but as they get recorded, the year-over-year picture will become clearer.
And sure, there will be many competing demands and needs for these surplus utilities budget funds. In my next blog I’ll suggest a few ways you can invest a small portion of the surplus now to pay great ongoing dividends in the future. Get ready to put on your BudgetCAP!
{{cta(‘549fec34-0824-46a9-ac8e-654f2fadf87c’)}}
<?
/******************************************************
TOP BOX HEADLINE
******************************************************/
?>
This website stores cookies on your computer. These cookies are used to collect information about how you interact with our website and allow us to remember you. We use this information in order to improve and customize your browsing experience and for analytics and metrics about our visitors both on this website and other media. For more information, read our Privacy Policy.
Functional
Always active
The technical storage or access is strictly necessary for the legitimate purpose of enabling the use of a specific service explicitly requested by the subscriber or user, or for the sole purpose of carrying out the transmission of a communication over an electronic communications network.
Preferences
The technical storage or access is necessary for the legitimate purpose of storing preferences that are not requested by the subscriber or user.
Statistics
The technical storage or access that is used exclusively for statistical purposes.The technical storage or access that is used exclusively for anonymous statistical purposes. Without a subpoena, voluntary compliance on the part of your Internet Service Provider, or additional records from a third party, information stored or retrieved for this purpose alone cannot usually be used to identify you.
Marketing
The technical storage or access is required to create user profiles to send advertising, or to track the user on a website or across several websites for similar marketing purposes.

 Best-in-class portfolio-level energy and utility bill data management and reporting.
  Real-time energy and sustainability analytics for high-performance, net-zero buildings.
  A holistic view of financial-grade scope 1, 2, and 3 carbon emissions data across your entire business.
  Energy and sustainability benchmarking compliance software designed for utilities.