


More than 100 organizations told us what a utility bill management platform is actually worth. The answer: a 3X average return on investment, and a lot fewer hours spent chasing bills, catchin...


Headquarters
EnergyCAP, LLC
360 Discovery Drive
Boalsburg, PA 16827
Denver, CO
Suite 500
5445 DTC Parkway
Greenwood Village, CO 80111
Dublin, Ireland
Unit F, The Digital Court, Rainsford Street,
Dublin 8, D08 R2YP, Ireland
Phone: 877.327.3702
Fax: 719.623.0577
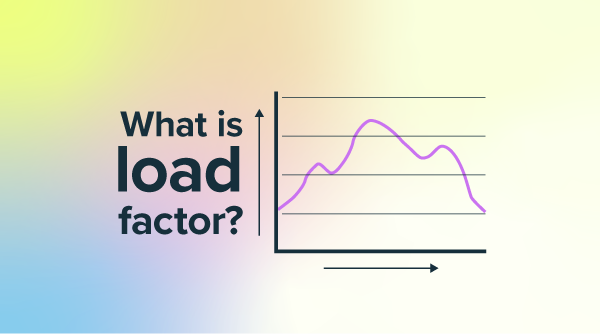
When speaking about electricity and reducing the cost of electric bills, there are two measurement parameters that need to be understood: consumption and demand. In the most basic terms, Consumption is the total amount of energy used in the billing period, and Demand is the highest momentary rate of consumption. Think of the demand charge as reflecting the maximum number of watts of electrical equipment turned on at any time over the entire billing period. It’s the amount of electricity the utility supplier must have the capacity to supply to that meter at any time, because at least for a brief period of time in the billing period, this peak amount of watts was needed.
For example, one 100-watt light bulb burning for 10 hours consumes 100 watts x 10 hours = 1,000 watt-hours or 1 kWh. The entire time it is on, it requires—demands—that the utility company must have 100 watts or 0.1 kW of electricity available.
Similarly, ten 100-watt light bulbs burning for 1 hour consume 1,000 watt-hours or 1 kWh. In both examples, the consumption is 1 kWh; however, the demand differs substantially. The initial scenario requires the utility vendor to provide just 100 watts of electricity, while the second scenario requires ten times that capacity.
The impact that demand can have on an organization’s utility bill can’t be overstated. Why? Because the demand charge on an electric bill can be very substantial. The example below illustrates that consumption is typically charged at a few cents per kWh, while demand is usually charged at a few to several dollars per kW.
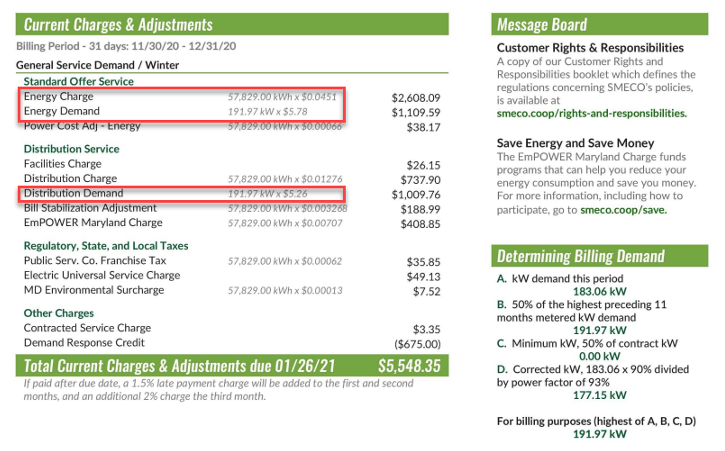
Take a look at some of your larger electric bills. You’ll probably see that peak demand charges can make up a large portion of the total bill, and in some cases, can exceed the consumption charge on an electric bill.
Types of Demand
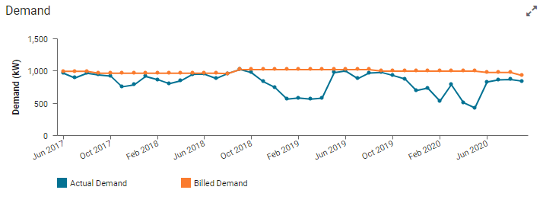
You may see two different types of demand on your bill: Actual Demand and Billed Demand. Actual demand is just what it sounds like. It’s the highest actual average 15- or 30-minute (varies by vendor or rate schedule) demand measured during the current billing period. The billed demand is the highest 15- or 30-minute demand for which you’re being billed. It’s not uncommon that Billed Demand may exceed Actual Demand due to the “fine print” terms of the published electric schedule.
Bills that show both actual demand and billed demand probably have a rate schedule term called a “demand ratchet.” In common practice, this means that if your demand for electricity is much higher during one particular month—for instance, during August in Phoenix—then the highest average 15-minute demand for that month will be billed for August and used as the Billed Demand basis for the next 11 months, even if the actual demand is lower during subsequent months. The only exception to this rule would be if your actual demand was greater than the August demand in a subsequent month. In that case, the demand that would be billed would increase to that higher number and be used as the basis for the billing demand for the following 11 months.
When your rate includes a demand ratchet you will be locked into your highest demand for 12 months (or whatever term your vendor’s rate schedule outlines). This demand “penalty” for a single instance of peak energy use can often be reduced through load reallocation, retrofits, and other energy management practices.
Quick check: Review a few of your most recent electric bills. If the Billed Demand is the same over multiple consecutive months, a demand ratchet is likely in effect.
Interval Data Analysis
Many energy management solutions can help you reduce your electric consumption, but to manage demand costs effectively, you need know where, when, and how efficiently the power is being used. That’s where interval data—recorded by vendor meters or installed submeters—comes into play.
Interval data will enable you to answer a variety of building-level questions, such as:
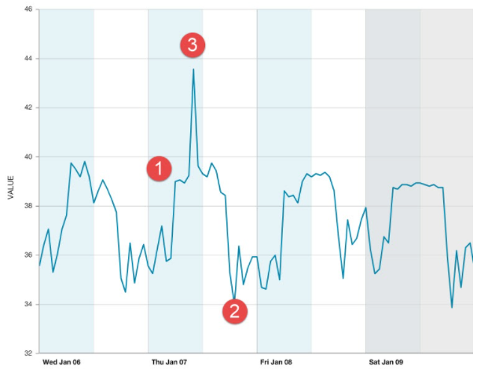 Is my building turning on at the expected time each day, or too early?
EnergyCAP has a flexible import tool that enables you to import files from any metering system, or we can manage the import process for you via our Smart CAPture service. Once in EnergyCAP, your interval data is available for detailed analysis, enabling you to identify costly demand issues.
Intelligent Audits
Abnormal demand issues can also be identified through EnergyCAP’s Intelligent Outlier Analysis audits. Using historic performance and weather data, EnergyCAP performs bill-by-bill regression analysis to determine if new bills are within expected ranges for use, cost, and demand. Outlier bills are automatically flagged for review based on the sensitivity levels you choose.
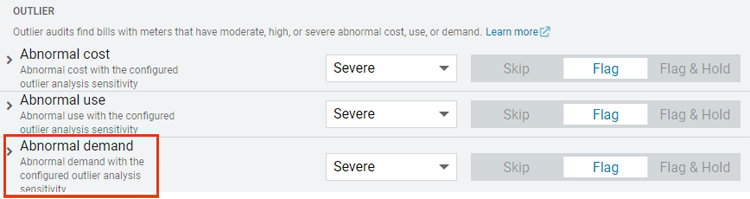
The automated utility bill audits can alert you to demand issues before they become long-term, expensive problems.
To learn more about demand management and other ways to reduce your energy cost and consumption, download our eBook, 20 Ways to Find Utility Bill Savings.