


The deadline is real, and it’s a data problem The first SB253 Scope 1 and 2 disclosures are due this August. LL97 reporting windows are already live. Benchmarking and building-performanc...


Headquarters
EnergyCAP, LLC
360 Discovery Drive
Boalsburg, PA 16827
Denver, CO
Suite 500
5445 DTC Parkway
Greenwood Village, CO 80111
Dublin, Ireland
Unit F, The Digital Court, Rainsford Street,
Dublin 8, D08 R2YP, Ireland
Phone: 877.327.3702
Fax: 719.623.0577
This eBook is most relevant for energy managers and other organization energy stakeholders tasked with review and analysis of utility bill information. A working knowledge of reporting needs and energy metrics is helpful but not necessary. This eBook explains effective benchmarking techniques and will help you benchmark more effectively to spot energy savings for your organization.
Energy benchmarking is a way of deriving value from your available energy data by comparing the performance of multiple peer group members. It is a way of determining how a place, building, or meter ranks in comparison with similar places, buildings or meters.
And why is that valuable? Because benchmarking is very easy, quick, and inexpensive to perform. Benchmarking seldom requires capital investment. It doesn’t require specialized labor or expertise. It doesn’t require engineers and consultants. And it doesn’t require much preparation. You can derive significant value just by tracking your utility bills, and then benchmarking meters and buildings using the energy information.
By comparing peers, you obtain information that can help you prioritize energy management actions. The most problematic buildings or meters, as determined by your benchmarking process, would typically be the ones that you would want to audit and/or retrofit first.
For example, suppose that you have two buildings that are very similar. They were built on the same floor plan at about the same time, but one ranks much lower than the other for energy efficiency. Perhaps the building is being operated poorly. There could be control problems. Benchmarking may not initially reveal specific issues, but it does help you quickly focus your attention on the problem building. And as you investigate, benchmarking may be able to reveal even more. If you find a building that ranks poorly, and a preliminary building analysis does not reveal problems with the building, then you might dig deeper and discover a meter problem or a billing problem.
There are four categories of popular building energy benchmarks:
The first category includes benchmarks provided by your utility vendor. These benchmarks are supplied in the form of periodic reports that demonstrate how you compare to other customers of the same vendor. These types of reports can often serve as a broad indicator of the relative efficiency of your building.
Another advantage of these reports is that you receive them for free. However, utility-provided reports might not account for any variables relating to your energy use. Without submetering, the report might lack granularity. It might contain a number of estimated bills. The benchmarking energy data might simply be raw calculations using the meter reading and multiplier for billing periods of varying lengths. These types of reports may spur questions, but seldom supply useful answers. This type of benchmarking data is generally not actionable.
The second category of benchmarking reports includes ENERGY STAR ratings. ENERGY STAR is probably the best-known building benchmarking system. It is widely used, and some surveys suggest that 85 percent of the adult population in the U.S. recognizes the ENERGY STAR brand.
ENERGY STAR uses a web-based software application (Portfolio Manager) to measure building energy efficiency on a 100-point scale for a variety of building types. By defining your building type and related characteristics, and by entering your building utility bill data into Portfolio Manager, you can obtain a benchmarking comparison with peer buildings in your geographical region. A favorable benchmarking score (75 or above) grants eligibility to pursue official ENERGY STAR recognition and certification, including a display plaque for your building location.
Unfortunately, ENERGY STAR can only account for a certain set of energy variables for a limited number of defined building types (currently 21). And even if your building matches one of the definitions, there might be some things that you do in your building that make your building unique in its peer group. ENERGY STAR might not be able to fully account for that type of use. This might make your rating lower, and there would be little you could do about it.
ENERGY STAR is probably the best-known building benchmarking system. It is widely used, and some surveys suggest that 85 percent of the adult population in the U.S. recognizes the ENERGY STAR brand.
In addition to government benchmarking, some industry or trade groups supply their own benchmarks within certain spaces (K12 school system, university, industrial, etc.). Often, industry-related benchmarking systems can be more relevant and specific to your building portfolio, which is good.
The ISO 50001 standard is a general purpose energy efficiency standard that is gaining traction in a variety of spaces. The National Association of Energy Service Companies (NAESCO) provides a variety of energy benchmarking resources to its members. The Association of Energy Engineers (AEE) is a trade association of more than 16,000 professionals worldwide, providing members with a variety of tools and resources for energy benchmarking, including seminars on using the ENERGY STAR benchmarking tool.
Other industry niche organizations may also maintain significant benchmarking resources, such as the U.S. Energy Information Administration’s CBECS survey.
Ask your trade association about available energy benchmarking tools and opportunities.
The final category of benchmarking tools/opportunities are supplied by energy management software. We can use the EnergyCAP energy management software Groups & Benchmarks feature to illustrate several benchmarking characteristics and possibilities:
Benchmarking in this manner has several advantages:
However, internal benchmarking may have limitations, especially if your organization is relatively small.
Suppose, for instance, that you have two buildings that are benchmarking at the same level in EnergyCAP. You might assume that neither building has a problem because of their similarity. However, there could be problems in both buildings. They could have been designed poorly. If the buildings are just about the same age, they might both have very inefficient mechanical systems that are heating and cooling at the same time. You might miss this unless you are comparing with a larger set of peer buildings.
That is where a tool like ENERGY STAR can be very helpful. Your two buildings may look good to you based on several internal peer benchmarking metrics, but what happens when you run the ENERGY STAR comparison? A poor rating using this “external” review may reveal that both of your buildings merit a closer look.

There are three keys to quality benchmarking.
The first key is to define closely-matched peer groups. It doesn’t make any sense to benchmark a fire station with a library, even if they were built in the same year.
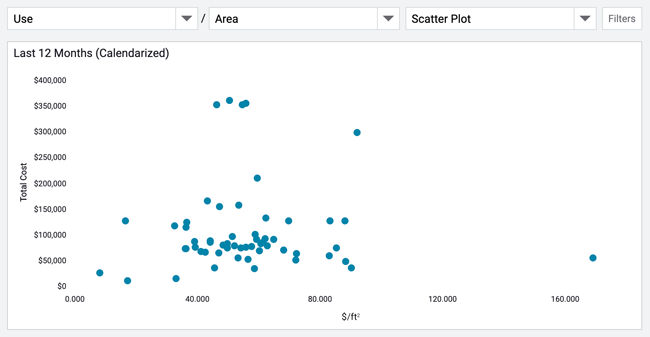
A second key is to prioritize benchmarking efforts based on the probable return for your investment of time and money. The following examples display building average costs per day, along with potential dollar savings if the buildings’ energy consumption is reduced to the group average.
As you might expect, the buildings that cost the most per day on average, also cost the most for the whole year. This particular comparison does not suggest a specific problem with a specific building, but it does answer a very specific question: “What are my most expensive buildings?” And this can be an important question to answer when considering energy management project alternatives. Benchmarking data answers that question very quickly and definitively.
The third key is to use benchmark metrics most likely to reveal energy issues. We could create a peer group for brick buildings and another peer group for steel and glass buildings, but we might quickly discover that external construction materials are not a very helpful or actionable indicator of energy efficiency. Building primary use (school, firehouse, dormitory, etc.) is a much more reliable energy benchmarking metric for a peer group.
Once you have grouped similar facilities together for benchmarking, the next step is to compare them with each other using the most revealing energy metrics. Following are several benchmarking metrics that are particularly useful for spotting opportunities and issues with your facilities.
In this benchmarking chart, the blue bars represent annualized costs per square foot. All buildings in the group are libraries. Cost per area is determined by dividing the total energy costs for the benchmarking period by the square footage for the buildings associated with the included meters.
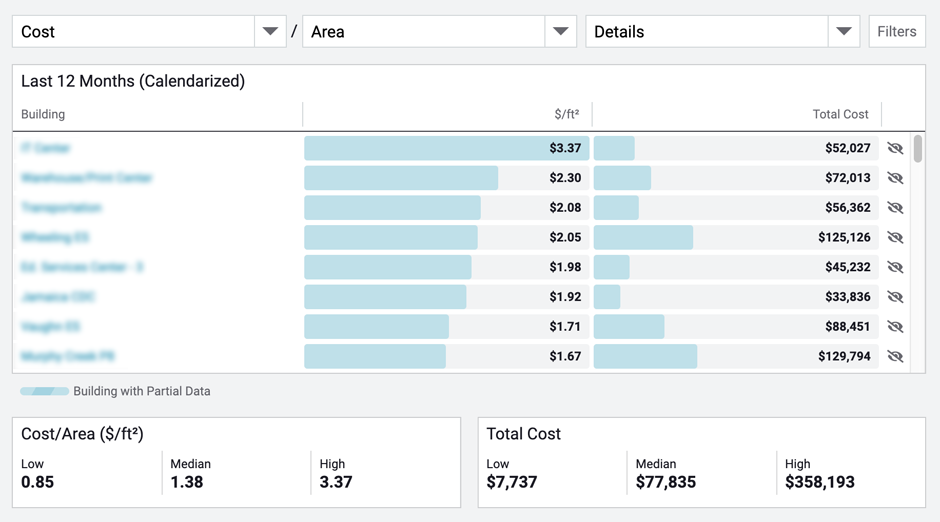
As you can see, the library at the top of the list is averaging $3.37 per square foot—more than double the group average of $1.38. Should this building occupy our attention and effort? Not necessarily. As total cost bar on the right indicates, total spending for the facility is only about $52,027 a year. However, the library in the number four position is averaging just $2.05 per square foot per year. And the associated energy spend is more than $125,000. This fourth facility presents a more significant savings opportunity than the facility in the first position.
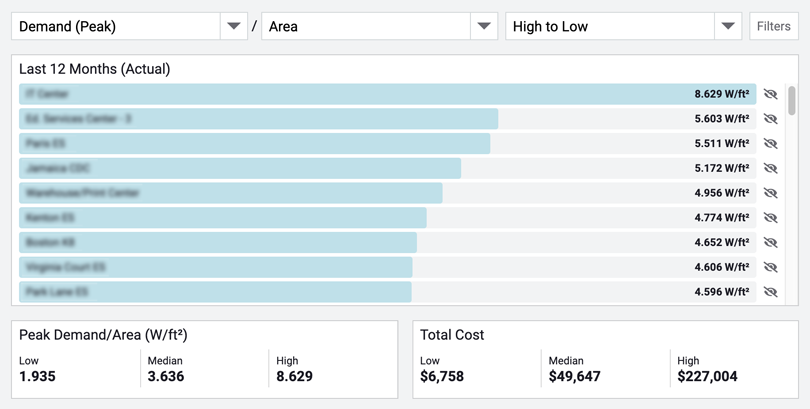
The next chart illustrates the benchmarking principle using peak electric demand as the comparison metric.
In this example, the peer buildings have similar equipment in them. Presumably they have the same kind of lighting. Why, then, does one building require 7.062 watts per square foot of peak demand when the average is less than 4 watts per square foot of peak demand? The most likely assumption is that the building offers controllable loads that are not being controlled. As a result, peak demand penalties may be driving up the utility costs. This is very good actionable information, gained from analysis of well-defined peer groups using appropriate metrics.
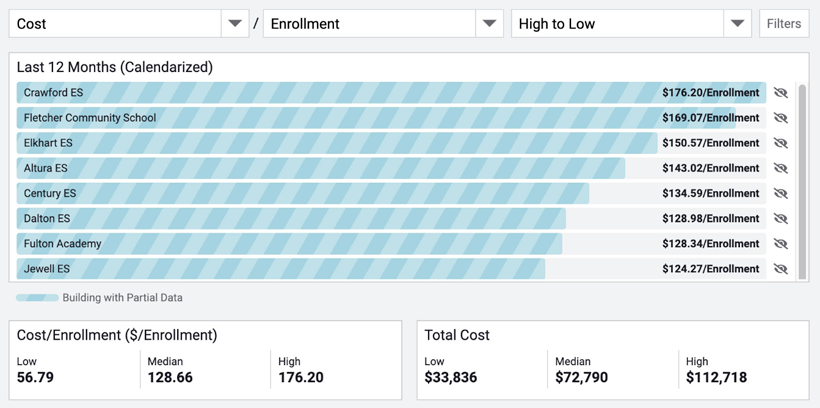
In addition to capabilities to benchmark cost, use, and by area or time, EnergyCAP provides the flexibility to define custom benchmarks. Custom benchmarks provide a virtually unlimited capability to compare cost and use factors with variables like occupancy, enrollment, hours of operation, number of visitors, and units of production.
Custom benchmarking provides answers to questions like, “What is our utility cost per resident?” “How much energy is required to produce a unit of our product?” “How much do we spend per business hour?” “How is utility use and cost related to occupancy?”
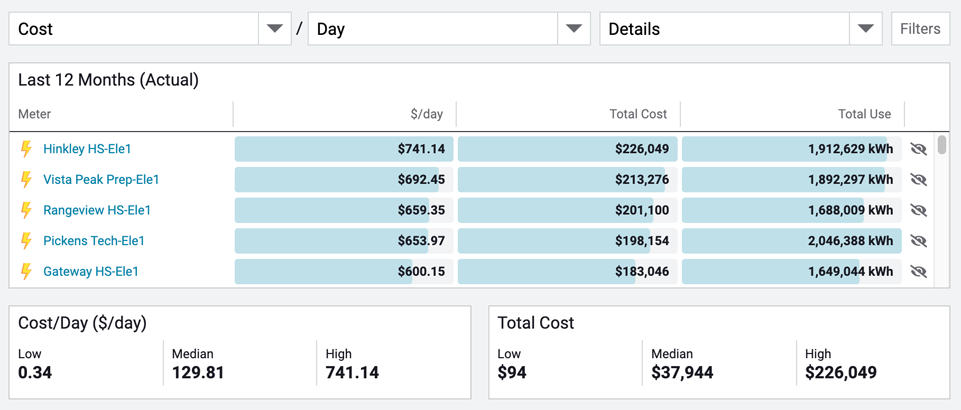
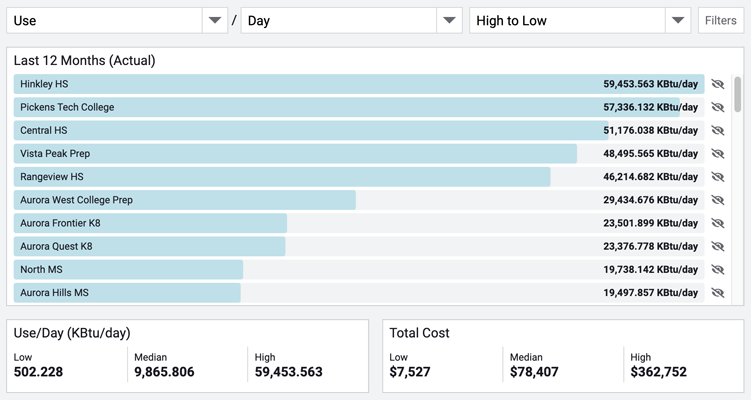
The next example is a meter-based peer group. The chart is displaying average cost per day. These are the five most expensive meters in the organization, so this chart will demand the energy manager’s monthly attention due solely to the magnitude of the energy spend. Benchmarking helps make this data quickly available.
The following chart is another meter-based chart, but the metric is average use per day. Again, these group members are the most expensive meters in the organization, but from a consumption perspective. If we were considering various energy conservation strategies, these are the meters we would look at most closely.
A final key to effective benchmarking is to filter out the noise in your benchmarking process. A good benchmarking system is one that allows you to quickly focus on the opportunities that offer the greatest return on your investment.
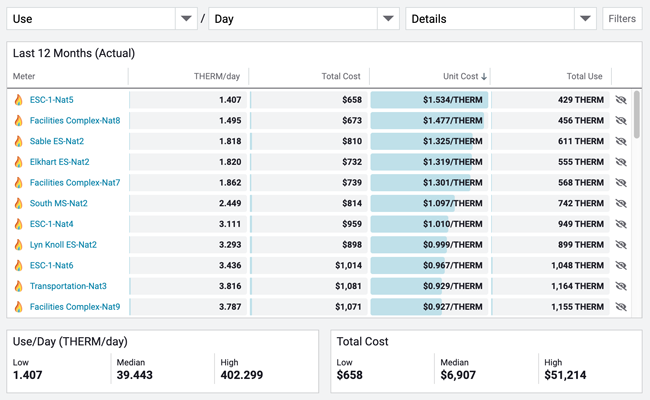
This next chart is a simple unit cost analysis. The chart is ranking each included meter by unit cost.
The unit cost for the worst meter has been calculated at a significant $1.534/THERM, three times the average unit cost. But when we look at Total Cost, we see that we have only spent $658 all year. It’s simply not worth our attention. It’s helpful to find a benchmarking system where it’s easy to separate the wheat from the chaff—to quickly recognize and exclude places and meters that do not offer a significant energy management ROI.
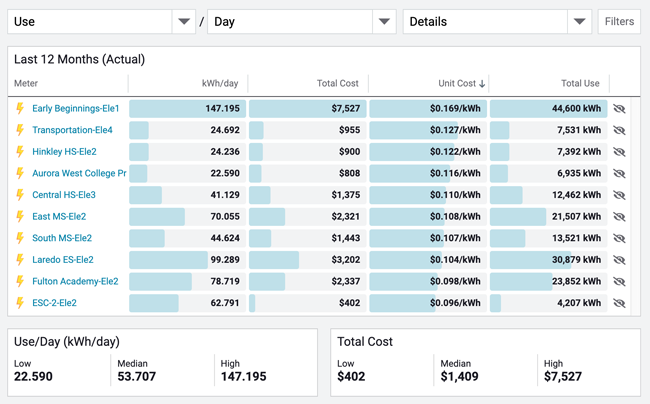
In this final example, we are only benchmarking the electric meters that have the same rate code and vendor. Peer meters are being ranked by unit cost.
We would expect that if these meters are all on the same rate schedule with the same vendor, then the average cost per kilowatt hour would be identical for each. But as you can see, the unit cost for the top building is almost 17 cents, and we are spending $7,500 for it every year.
Several other meters in this chart are averaging well above the peer average of about 11 cents per kilowatt hour. Time to investigate! This benchmarking chart, manually created using rate schedule as a filter, can be very revealing.
See how your building's energy use intensity (EUI) stacks up to its peers—benchmark your building's energy efficiency with our free calculator tool.
Benchmark your building's energy performance