Welcome to my blog series, #3 of 5, on Effective Energy Management from Home. If you haven’t read Blogs #1 & #2, I recommend you give them a quick read first.
You’re an Energy Manager working from home. Your buildings are mainly unoccupied and in shutdown mode, right? A bright side to the crisis is that you’re saving a lot of energy and water.
Or are you? How do you know? Wait a month or two for the utility bills? By then, it’ll be too late. You think and hope your buildings are properly set back or shut down, but without normal occupants or maintenance, custodial, and operations workers there, to say nothing of your occasional walk-throughs, it’s impossible to know for sure.
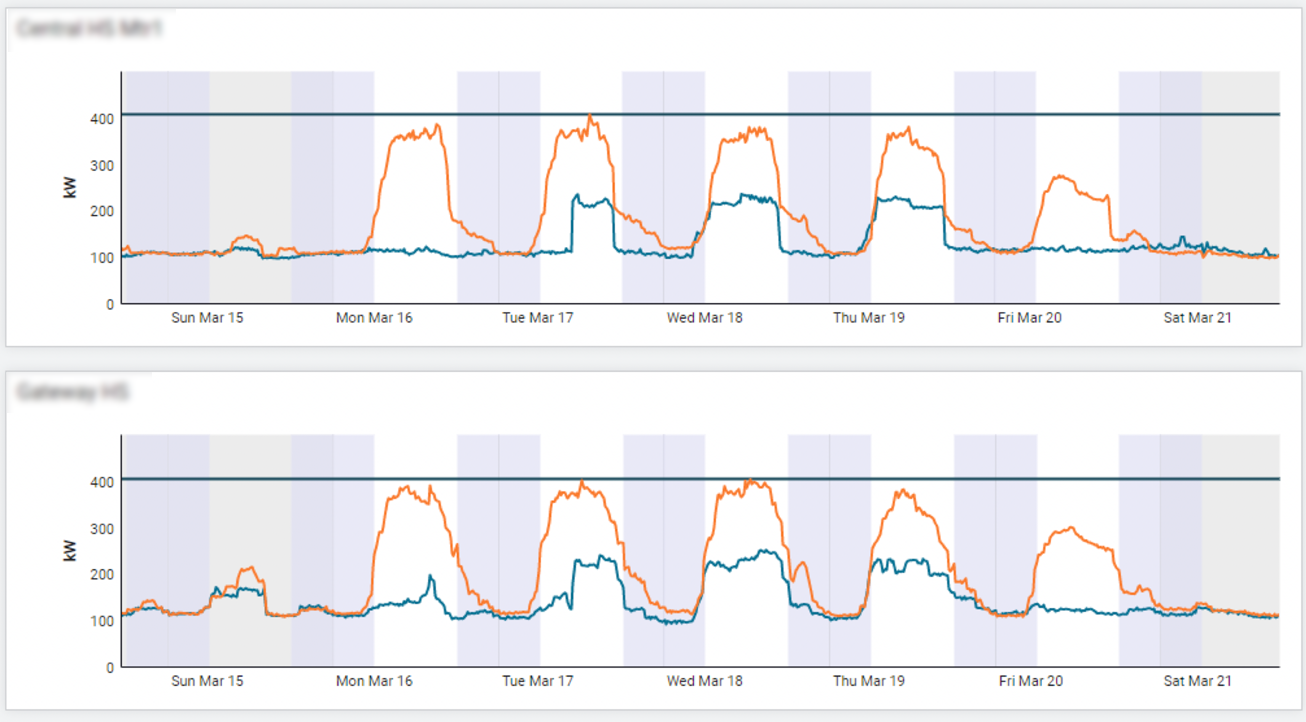
You have no ears and eyes in the building. And that’s where smart meters and interval data play a vital role in conservation and effective building operations. Below are EnergyCAP interval data dashboard charts for two high school main electric meters. The orange line is the prior week when school was in session. The blue line is the first Governor-ordered shutdown week. Shaded areas are night times and weekends. White areas are weekdays, 6AM–6PM. As the Energy Manager, do you see anything you wish you had checked?
Here’s one, at High School #1, the March 16 and March 20 daytime shutdowns were terrific, right in line with the weekend shutdown load of a steady 100 kW. But what happened on March 17–19? Someone or something turned on an extra 150 kW for most of the day. High School #2 experienced about the same. Even though you’re sitting at home, you could have pulled up the EnergyCAP Dashboard, seen the interval charts in near real time, and immediately investigated (via security cameras, EMS, phone calls) and possibly killed a few hundred unnecessary kWs in just these two schools. And you’re responsible for 50 other buildings, as well. At an average cost of 12 cents/kWh, that’s a daytime savings of about $1.50 per kW of reduction per day. Multiply that by thousands of excess kW and perhaps dozens of days of planned shutdowns, and the savings quickly climbs into the thousands of dollars.
Instead of sitting at home feeling frustrated by an inability to make a contribution, think of your great sense of accomplishment when you’re able to remotely view the buildings’ “heartbeats” and immediately take action to correct suspected problems…and all while wearing your pajamas!
Stay well! Let us know if you’d like to discuss interval data features in EnergyCAP: acquiring interval data from vendors, connecting to existing metering systems, or installing meters or data logging devices.
Best wishes that you can use your work-from-home time to become a more effective Energy Manager.
Normal processes disrupted due to work-at-home restrictions? The EnergyCAP team is fully operational and available to help you. Contact us if you need assistance with data entry or management, user training, or other EnergyCAP-related process.
<?
/******************************************************
TOP BOX HEADLINE
******************************************************/
?>
This website stores cookies on your computer. These cookies are used to collect information about how you interact with our website and allow us to remember you. We use this information in order to improve and customize your browsing experience and for analytics and metrics about our visitors both on this website and other media. For more information, read our Privacy Policy.
Functional
Always active
The technical storage or access is strictly necessary for the legitimate purpose of enabling the use of a specific service explicitly requested by the subscriber or user, or for the sole purpose of carrying out the transmission of a communication over an electronic communications network.
Preferences
The technical storage or access is necessary for the legitimate purpose of storing preferences that are not requested by the subscriber or user.
Statistics
The technical storage or access that is used exclusively for statistical purposes.The technical storage or access that is used exclusively for anonymous statistical purposes. Without a subpoena, voluntary compliance on the part of your Internet Service Provider, or additional records from a third party, information stored or retrieved for this purpose alone cannot usually be used to identify you.
Marketing
The technical storage or access is required to create user profiles to send advertising, or to track the user on a website or across several websites for similar marketing purposes.

 Best-in-class portfolio-level energy and utility bill data management and reporting.
  Real-time energy and sustainability analytics for high-performance, net-zero buildings.
  A holistic view of financial-grade scope 1, 2, and 3 carbon emissions data across your entire business.
  Energy and sustainability benchmarking compliance software designed for utilities.