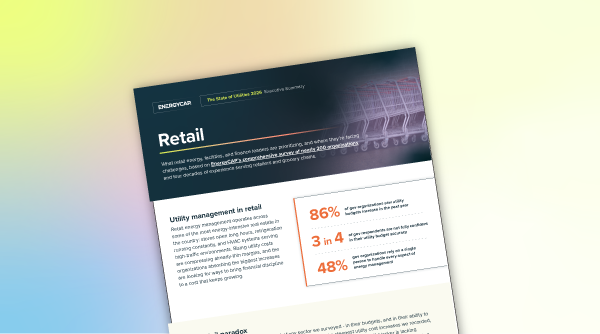


For most organizations, energy and utility costs sit quietly in the background; processed, paid, and filed away as a routine operating expense. But that mindset is becoming increasingly risky....


Headquarters
EnergyCAP, LLC
360 Discovery Drive
Boalsburg, PA 16827
Denver, CO
Suite 500
5445 DTC Parkway
Greenwood Village, CO 80111
Dublin, Ireland
Unit F, The Digital Court, Rainsford Street,
Dublin 8, D08 R2YP, Ireland
Phone: 877.327.3702
Fax: 719.623.0577
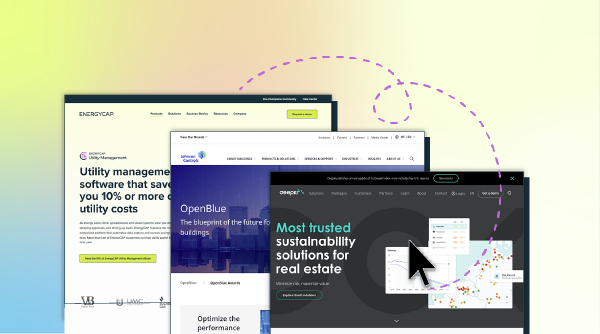
Juggling utility bills, tangled data, shifting rates, and nonstop stakeholder questions is exhausting. The right energy management tools help you move from spreadsheet chaos to confident decisions. They surface anomalies fast, support budgets, simplify reporting, and show where to cut costs without hurting comfort or operations.
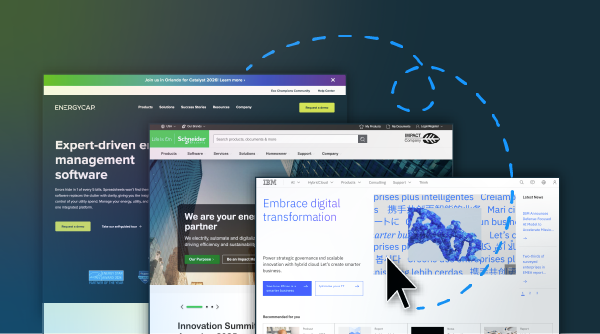
Our guide rounds up 14 trusted tools for energy management that energy managers use every day. You’ll see which tool is best for each task and the key features that matter, from benchmarking and forecasting to GHG tracking and incentive discovery.
| Energy management tool | Best for | Key features |
|---|---|---|
| EnergyCAP Utility Management | Reducing energy spend with utility management and reporting |
|
| Database of State Incentives for Renewables & Efficiency® (DSIRE) | Finding current incentives and policies by state or territory |
|
| Weather Data Depot | Heating and cooling degree-day comparisons for normalization |
|
| MEASUR software tools | Industrial system assessments and savings quantification |
|
| Energy benchmarking calculator | Fast EUI screening and peer comparison for buildings |
|
| Rooftop unit comparison calculator | Life-cycle cost screening of RTU replacements and upgrades |
|
| Grid-interactive efficient building strategies and technologies workbook | Structuring a GEB retrofit plan and shortlist |
|
| PVWatts calculator | Estimating PV production and capacity factor for early scoping |
|
| Customer damage function calculator | Quantifying outage costs to justify resilience investments |
|
| Data center profiler (DC Pro) | Early-stage data center energy profiling and opportunity scans |
|
| EnergyPlus energy simulation | Detailed whole-building energy modeling and HVAC analysis |
|
| 50001 Ready Navigator | Building an ISO 50001-aligned energy management system |
|
| Low standby power product list | Procuring devices that meet federal low-standby requirements |
|
| RESFEN | Comparing residential window options for energy and cost impacts |
|
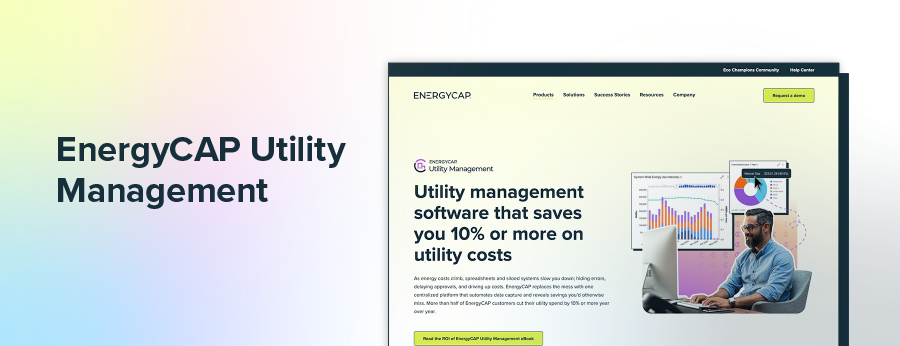
Best for: Reducing energy spend with utility management and reporting
Key features:
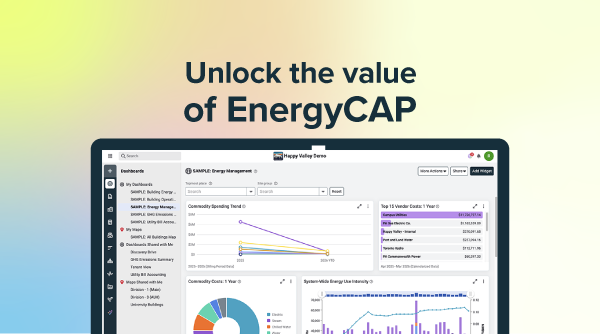
As one of the most effective energy asset management tools, EnergyCAP Utility Management gives you one source of truth for every utility, meter, and site. It centralizes bills, rate schedules, interval data, and submeters. Automated validation catches duplicates, estimates misses, and flags anomalies before they hit budgets. Portfolio views roll up cost, use, demand, and GHG, while Powerviews make it easy to share what matters with finance, sustainability, and operations.
The platform streamlines the entire workflow with Bill CAPture automation, AP and GL integrations, and alerts that drive timely action. You get forecasting and budgets, benchmark charts, Cost/Area, Average Daily Cost, Average Daily Use, and EUI tracking with ENERGY STAR® Portfolio Manager® sync. You can use the data tree to mirror your organization hierarchy, compare sites and groups, and turn messy utility complexity into clear decisions.
Pro Tip: Smart Analytics software give you insights into what’s driving usage and allows you to catch issues early; all before your next utility bill.
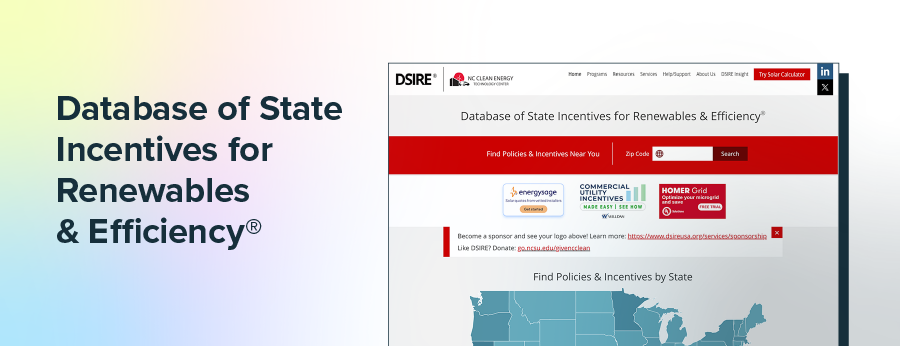
Best for: Finding current incentives and policies by state or territory
Key features:
The Database of State Incentives for Renewables & Efficiency® (DSIRE) is a nationwide directory of policies and incentives that support renewable energy and energy efficiency across the United States. Since 1995, the N.C. Clean Energy Technology Center has operated it, helping you quickly find programs by state, territory, or federal level.
You can search by ZIP code or state, then drill into program details, and use summary maps and tables for a higher-level view. DSIRE also offers an API for integrations and a consulting arm for deeper analysis, making it useful for scoping projects, building business cases, and timing applications before deadlines.
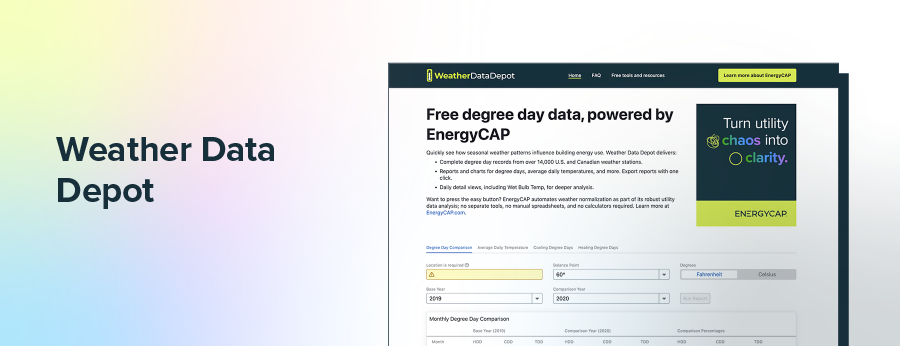
Best for: Heating and cooling degree day comparisons for normalization
Key features:
Weather Data Depot is a free web tool for quick heating and cooling degree day analysis. It pulls historical daily temperatures, rolls them into HDD and CDD totals. It lets you compare seasons across thousands of U.S. and Canadian weather stations. You can use it to explain weather‐driven variance, normalize utility use, and support budgets and forecasts.
Pick a location by city or ZIP code, choose HDD or CDD, and a base temperature, then generate multi-year comparisons to see trends at a glance. The site updates with fresh data, includes short-term degree day forecasts, and provides simple one-click exports to spreadsheets and reports. To plan for rate inflation beyond weather-related effects, review forecasts of U.S. water and sewer costs.
Pro Tip: For ways to pair comfort targets with financial goals, check out our webinar recap, “Bridging the Gap Between Facility Comfort and Financial Control.”

Best for: Industrial system assessments and savings quantification
Key features:
MEASUR is a free, open-source suite from the U.S. Department of Energy that helps industrial teams identify, assess, and quantify energy savings across core systems. These systems include pumps, fans, steam, process heating, motors, compressed air, lighting, and wastewater treatment. It offers a growing library of assessments and more than 40 built-in calculators for quick engineering estimates.
MEASUR is maintained by Oak Ridge National Laboratory and actively updated on GitHub. It is designed to support plant-level efficiency projects and energy management software. MEASUR includes pathways that align with ISO 50001 and the Superior Energy Performance program. It offers a single, no-cost toolkit that standardizes assessments, provides data-driven recommendations, and supports decarbonization.

Best for: Fast EUI screening and peer comparison for buildings
Key features:
Energy benchmarking calculator is a free tool that helps you benchmark a building’s energy use. It calculates Energy Use Intensity (EUI) and shows how your building compares to similar facilities, using data aligned with U.S. Energy Information Administration sources. You can use it to spot performance gaps, prioritize projects, and support ordinance readiness.
Enter a few basics—such as building type, square footage, and annual utility consumption—and the calculator will return an EUI with context for your sector. It is designed for quick scoping and for sharing results with stakeholders so that you can move from questions to action in minutes.

Best for: Life-cycle cost screening of RTU replacements and upgrades
Key features:
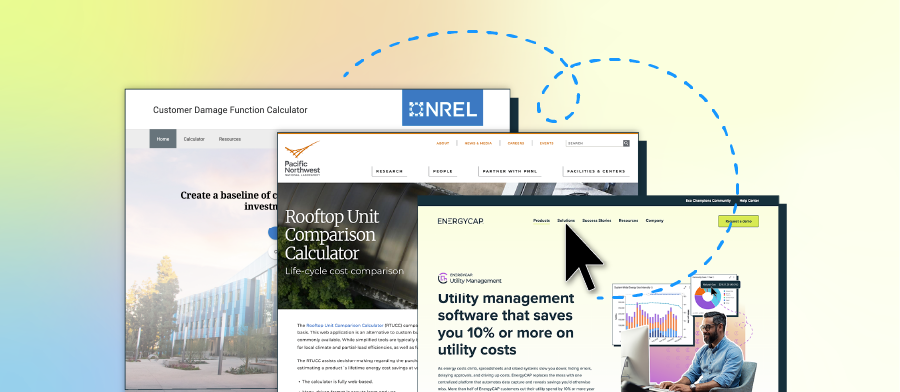
The rooftop unit comparison calculator (RTUCC) from Pacific Northwest National Laboratory helps you compare standard and high-efficiency rooftop air conditioners and heat pumps on a life-cycle cost basis. The tool factors in local climate, part-load performance, and typical building use with prototypical EnergyPlus models. The result gives you more detail than a simple full-load calculator.
The web app estimates life-cycle cost, simple payback, return on investment, and savings-to-investment ratio. It lets you download results for presentations and budget support. You can use it as a screening tool when planning replacements or specifying new units. After that, you can move to detailed design if the economics check out.
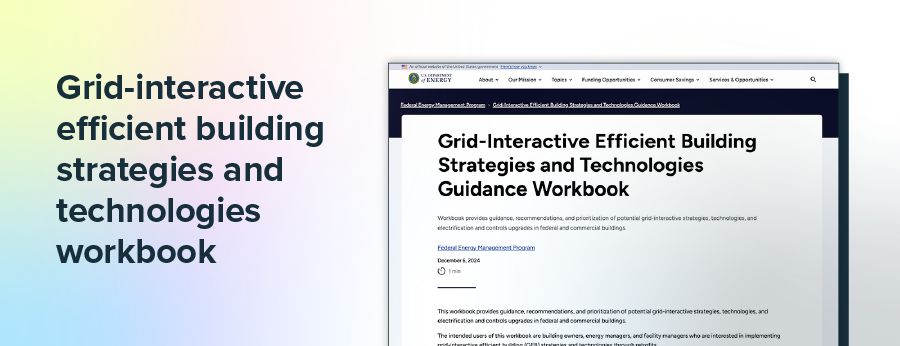
Best for: Structuring a GEB retrofit plan and shortlist
Key features:
The grid-interactive efficient building strategies and technologies workbook from DOE’s Federal Energy Management Program is a practical guide to planning GEB retrofits. It explains core concepts and helps you identify, screen, and prioritize strategies and technologies. The guide includes upgrades to electrification and controls. It is excellent for moving from an idea to a project shortlist.
The workbook complements FEMP’s broader GEB resources with worksheets, analysis steps, and links to high-value technologies that enable demand flexibility and improve resilience. You can use it alongside the GEB technologies list to shape scopes, align with tariffs, and plan performance-contract projects.


Best for: Estimating PV production and capacity factor for early scoping
Key features:
The PVWatts calculator estimates energy production for grid-connected solar PV systems. You can enter a location, system size, tilt, azimuth, and expected losses to get monthly and annual AC generation, capacity factor, and a quick cost estimate.
PVWatts uses NREL’s National Solar Radiation Database and is also available as an API for integrations. Recent updates include bifacial options and improved models. If you manage a multi-site renewables portfolio, pair PVWatts with analytics tools for renewable energy portfolio management to compare production, budgets, and performance across locations.
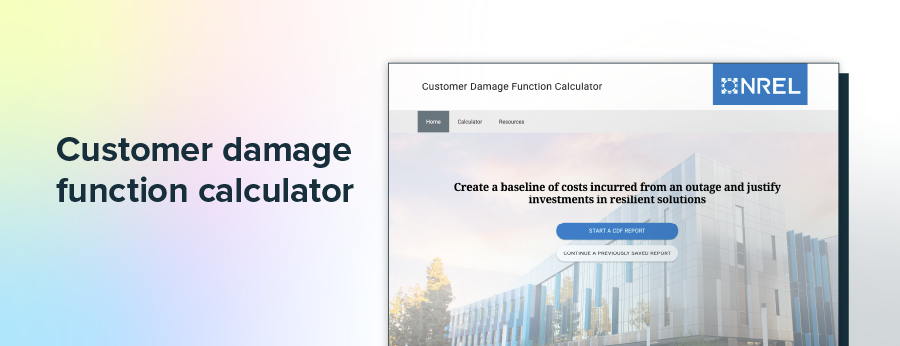
Best for: Quantifying outage costs to justify resilience investments
Key features:
The customer damage function calculator helps you estimate the dollar impact of power (and water) outages at your site. Built by NREL with support from DOE’s Federal Energy Management Program, the free web tool establishes a baseline for outage risk. It shows how costs increase with outage duration and quantifies the potential value of resilience investments.
You enter facility details and critical loads, then select cost categories to capture immediate losses and time-dependent impacts. The tool produces a customized breakdown you can use to compare scenarios, justify backup systems or DER projects. It also serves as a renewable energy risk management tool when you evaluate DER and microgrid scenarios, outages, and avoided-cost benefits.
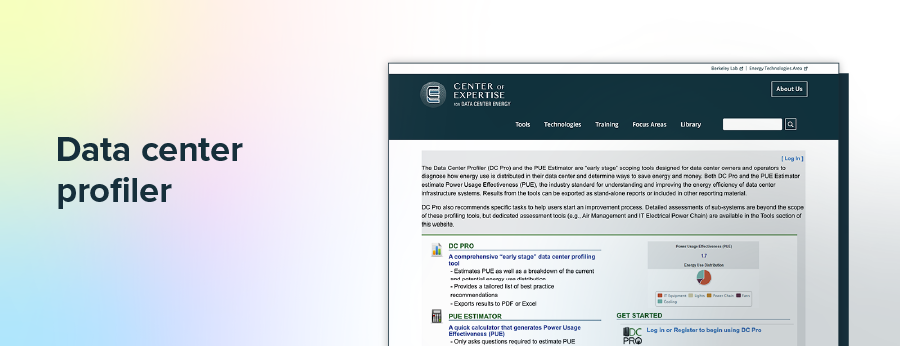
Best for: Early-stage data center energy profiling and opportunity scans
Key features:
Data center profiler (DC Pro) is an early-stage scoping tool from Lawrence Berkeley National Laboratory and the DOE; it helps data center teams diagnose energy use and identify where to save. It estimates current and potential Power Usage Effectiveness (PUE), shows energy-use distribution across systems, and is not intended as an investment-grade audit.
You can generate a quick profile, then use assessment modules for areas such as air management and the electrical power chain to refine opportunities and export a summary for stakeholders. Results support prioritization, budgeting, and training through DOE’s Data Center Energy Practitioner program, with estimates based on user inputs and typical practice.

Best for: Detailed whole-building energy modeling and HVAC analysis
Key features:
EnergyPlus is an open-source, physics-based whole-building modeling engine funded by DOE and managed by NREL. It models energy use for heating, cooling, ventilation, lighting, plug loads, and water. It offers detailed algorithms for loads and HVAC systems. You can use it to test design options, evaluate retrofits, and study grid-interactive strategies with validated calculations.
EnergyPlus runs through text-based input files or via toolsets such as OpenStudio that provide a modeling SDK and user interfaces. It traces its lineage to DOE-2 and BLAST, adds modern heat balance methods, and is updated on a regular release cadence. Results support code studies, research, and investment decisions where accuracy and transparency matter.

Best for: Building an ISO 50001-aligned energy management system
Key features:
50001 Ready Navigator is a no-cost, online guide from the DOE and Lawrence Berkeley National Laboratory; it walks teams through building and maintaining an energy management system aligned with ISO 50001. The tool organizes work into 25 tasks, provides detailed guidance, templates, and optional worksheets. It also supports collaboration across multiple sites. The navigator is updated to reflect the 2018 revision of ISO 50001 and is part of DOE’s 50001 Ready program.
You can track progress in a dashboard, assign tasks, and request 50001 Ready recognition when requirements are met. The platform also offers training materials and an energy management assessment to help teams prepare, measure performance improvement, and sustain continual improvement over time.

Best for: Procuring devices that meet federal low-standby requirements
Key features:
The low standby power product list catalogs products that meet Federal Energy Management Program purchasing requirements for low standby energy use. It focuses on categories where devices draw power when “off,” such as computers and audio or telecom equipment. It is updated using ENERGY STAR–qualified product lists. Many listed models meet a standby threshold of one watt or less, helping buyers cut waste across large fleets.
For federal procurement, the list simplifies compliance with FAR 23.107-3: buy items that meet FEMP’s standby recommendation. If none exists for a listed product, you can choose models that use no more than one watt in standby. Energy managers can reference the database during sourcing to document compliance and justify the total cost of ownership.
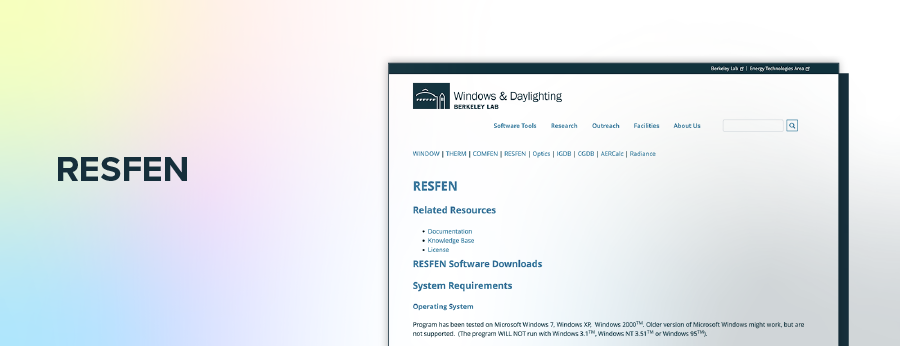
Best for: Comparing residential window options for energy and cost impacts
Key features:
RESFEN models how different residential window options affect heating and cooling energy use, utility cost, and peak loads. Developed by Lawrence Berkeley National Laboratory with DOE support, it lets you compare window and skylight choices by climate and house type to identify cost-effective upgrades. The tool is widely referenced for estimating window impacts in homes and underpins ENERGY STAR savings analyses for residential fenestration.
You define scenarios by selecting location, HVAC system, efficiency, utility rates, window area and orientation, and shading conditions. RESFEN models a prototypical house for that location using DOE-2 methods and reports annual energy and cost differences between window options. It also connects with LBNL’s WINDOW and THERM tools to use rated U-factor and SHGC inputs when available.
The right mix of energy management tools turns questions into actions. Use incentives to fund projects, weather data to normalize use, calculators to screen options, and modeling to de-risk decisions. With the basics covered, you can focus on budgets, performance, and measurable changes to drive massive utility savings across your portfolio.
EnergyCAP Utility Management is the best place to start because it provides a single source of truth for every bill, meter, and site. You get automated bill validation, powerful rollups for cost, use, demand, and GHG, plus Powerviews to share insights with finance, carbon accounting, and operations. Request an EnergyCAP demo and see how much you can save.
Energy management commonly breaks into four focus areas:
Energy management equipment measures, controls, or reduces energy use, such as utility meters and submeters, sensors, building automation systems, smart thermostats, VFDs, lighting controls, and data loggers.
Energy management techniques are methods teams use to cut waste, control costs, and track results. Here are a few common approaches that energy managers might take:
A KPI in energy management is a metric that tracks performance against goals. Some metrics, such as budget variance and documented cost avoidance, allow energy managers to show prevented spend.
Common energy management KPIs include:
Seven high-impact actions to cut use without sacrificing comfort include: