


Benchmarking and compliance are often treated as reporting exercises or tasks to need completing to satisfy regulations or external mandates. In reality, when done well, they are powerful to...


Headquarters
EnergyCAP, LLC
360 Discovery Drive
Boalsburg, PA 16827
Denver, CO
Suite 500
5445 DTC Parkway
Greenwood Village, CO 80111
Dublin, Ireland
Unit F, The Digital Court, Rainsford Street,
Dublin 8, D08 R2YP, Ireland
Phone: 877.327.3702
Fax: 719.623.0577
Increasing greenhouse gases and overall concerns about the climate have led to a global push for more advanced Energy and Sustainability Reporting.
If you’re just getting started with sustainability, you may be wondering: When it comes to greenhouse gases (GHGs), are all factors equal? A wide variety of factors contribute to GHG emissions, such as capital goods, purchased goods and services, transportation, waste, water, energy, and more.
As it turns out, 40% of global greenhouse gas emissions come from buildings, and if we continue to operate business as usual, they’re set to double by 2050. So, focusing on building emissions is one of the best ways to reduce greenhouse gas emissions. The good news, utility data from buildings is ubiquitous and relatively easy to measure, making it the ideal starting place for sustainability reporting.
However, you can’t manage what you don’t measure. Many businesses simply do not efficiently and accurately track building energy usage, which makes it much more difficult to reduce greenhouse gas emissions.
If you want to take control of your data, the fastest way to do so is to employ energy reporting best practices. This blog reviews these best practices and helps you gain a better understanding of where your organization needs to improve.
There’s a lot more to energy and sustainability reporting than you may realize. It’s not a switch you can flip on or off, but rather a continuum you can travel along to meet your performance goals. Energy reporting is broken down into four distinct steps:
Capturing energy usage data is essential, but it shouldn’t be filed away to collect dust. Taking this data and visualizing it makes it much easier to identify trends, errors, and other actionable insights. Sharing these insights with decision-makers helps get the ball rolling. Finally, analyzing the data over time ensures sustainability can be achieved.
Since you can’t manage what you don’t measure, capturing and organizing your energy usage data is the most important part of the process. However, the way organizations capture this data matters quite a bit; some methods are much more efficient and accurate than others.
There are four levels to the data capture continuum:
Where does your organization fall on the data capture continuum? We polled attendees during a recent webinar on energy reporting best practices, and these were the results:
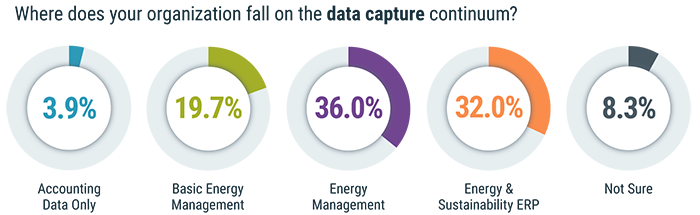
These poll results are encouraging because it shows that the average organization is on the mature end of the data capture continuum. However, 68% of those polled rated their organizations lower than “Energy & Sustainability ERP,” meaning there’s also a lot of room for growth in the effort to reduce greenhouse gas emissions.
Capturing data consistently and accurately is essential to energy reporting as well as any sustainability initiatives. Manual processes, such as manually copying utility bill data into spreadsheets, lead to inconsistent and inaccurate data. When organizations cannot trust their data, they cannot optimize their energy usage.
Additionally, manually recording energy usage data requires a lot of time and money that businesses often do not have. Automating the data capture process is significantly more efficient, allowing energy managers to spend their time more wisely.
Capturing energy usage data is a great start, but data on its own is often difficult to digest. Visualizing this data is the best way to identify trends, errors, and other useful nuggets of information.
There are four levels to the data visualization continuum:
Where does your organization fall on the data visualization continuum? We polled attendees during a recent webinar on energy reporting best practices, and these were the results:
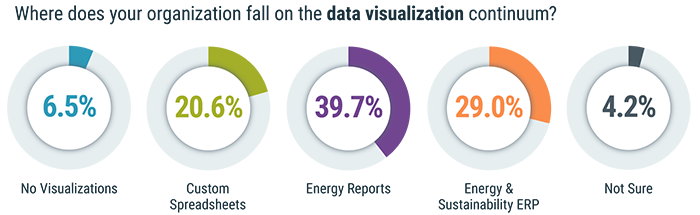
Once again, these results are encouraging to see. Still, the ultimate goal is for these visualizations to be effortless to produce, and the vast majority of those polled indicated they were relying on methods that are burdensome.
Much like with the data capture process, manually creating reports, visuals, and dashboards can be very time-consuming. Even worse, reports that are created manually need to be recreated when new data is available. Organizations interested in energy reporting best practices should look to find software that can create visualizations and dashboards automatically.
Data sharing is an easily overlooked aspect of energy reporting best practices. However, for any sustainability strategy to succeed, it’s essential that energy usage data is communicated to stakeholders and other decision-makers.
There are four levels to the data sharing continuum:
Where does your organization fall on the data sharing continuum? We polled attendees during a recent webinar on energy reporting best practices, and these were the results:
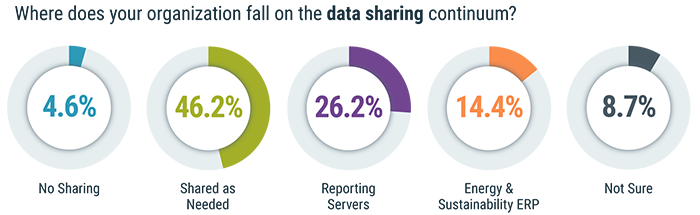
The poll results here show a noticeable shift toward the lower end of the continuum, with 59.5% of organizations occupying that space. Organizations must strive to be consistent with energy reporting; being adept at data capture and visualization isn’t enough.
Collecting and visualizing energy usage data is great but failing to share it makes all the effort pointless and does nothing to help reduce an organization’s greenhouse gas emissions. Stakeholders and decision-makers need to be aware of energy usage data in order for the proper actions to be taken.
For data sharing to be effective, it should also be a very simple process. The more steps it takes to share something, the less effective it will be. If possible, sharing dashboards and other visuals should be as easy as clicking a button. Even better would be automated reports that are periodically sent to stakeholders.
The ultimate goal of an energy and sustainability strategy is to reduce energy consumption, emissions, and cost which is why this final step in energy usage reporting is so important. Capturing, visualizing, and sharing the data is only effective if the organization analyzes the data to make improvements.
There are four levels to the data analysis continuum:
Where does your organization fall on the data analysis continuum? We polled attendees during a recent webinar on energy reporting best practices, and these were the results:
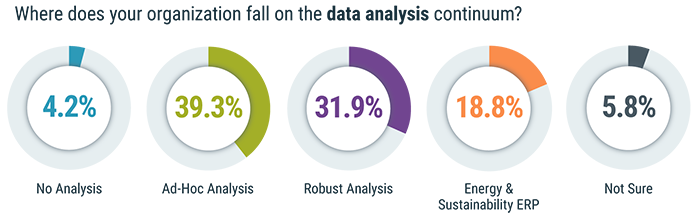
Similar to data sharing, this poll indicates that there’s some work to be done when it comes to data analysis. While it’s clear that many organizations do have processes in place for energy and sustainability reporting, most have some work to do when it comes to implementing best practices.
Analyzing your organization’s energy usage can elevate reduction opportunities. Failing to do any analysis, or only reviewing the data when it’s absolutely necessary, will not move the needle for a company’s energy usage. Any organization that wants to employ energy reporting best practices should invest in software to help identify areas for improvement.
Continuing to rely on spreadsheets, manual processes, subpar reporting, and other inefficiencies won’t help you meet energy reduction mandates, save money, or achieve net-zero emissions. If you’re an energy or sustainability leader that wants to take control of your data and employ energy reporting best practices, EnergyCAP’s energy management and utility bill accounting software is the perfect solution.
EnergyCAP is the only Energy & Sustainability ERP that empowers Energy & Sustainability leaders with full control and understanding of all energy data points to manage consumption, reduce their carbon footprint, and drive savings.
With EnergyCAP, your organization can:
If your organization is determined to reduce greenhouse gas emissions, EnergyCAP is the perfect sustainability partner. Request a live demo to see why over 10,000 energy managers trust our software.