


EnergyCAP’s recent State of Utilities survey makes one thing clear: utility costs are rising. Aging infrastructure, new loads including data centers, and rate increases are all adding pressu...


Headquarters
EnergyCAP, LLC
360 Discovery Drive
Boalsburg, PA 16827
Denver, CO
Suite 500
5445 DTC Parkway
Greenwood Village, CO 80111
Dublin, Ireland
Unit F, The Digital Court, Rainsford Street,
Dublin 8, D08 R2YP, Ireland
Phone: 877.327.3702
Fax: 719.623.0577
This eBook was born out of a need to create awareness of the merits of energy and sustainability management software for building energy efficiency and decarbonization. It outlines the top 5 must-have features to look for when evaluating a solution for your buildings.
Buildings are notoriously complex and dynamic; however, they play a critical role in the journey to net zero. Nearly 40% of carbon emissions worldwide are generated by buildings, 28%¹ of which are operative emissions attributed to activities such as the heating, cooling and powering of building facilities. In 2040, it’s reported that approximately two-thirds of the global building stock will consist of buildings that exist today,² revealing that there is much to be done to get the buildings that we live, work and play in up to par with carbon reduction targets and sustainability standards.
Considering the impact of buildings on global warming, real estate owners, investors, and large enterprises alike are at a crucial point where they need to take decisive, swift action to implement technology that enables strategies toward decarbonization, resource efficiency and cost reduction. Business and property owners are facing mounting regulatory and consumer pressures exacerbated by inflation and an unprecedented rise in energy prices, severely impacting running costs and profits. Adopting technology that delivers actionable, data-driven insight to direct sustainability and cost savings initiatives is critical to their success.
Data—asset or stumbling block in move to sustainability buildings?
The existing proliferation of data from buildings creates the need for a far more sophisticated solution than has been traditionally employed in the form of spreadsheets, to manage, organize and analyze data related to their performance. This need is further highlighted by the growing number of meters, sensors, and other IoT devices expected to be deployed in the coming years. The sustainability industry is reported to already have 5 billion IoT-connected devices as of December 2021.³
Fortunately, technology has progressed to match the specific needs of energy and sustainability managers, analysts and engineers. However, a lot more needs to be understood about the features and capabilities of the available software solutions that help them collect, manage, organize, analyze, and report on data efficiently and effectively. This understanding helps to overcome key challenges and stresses that can severely delay and de-motivate those working toward sustainability, resource, and cost-efficiency in their organizations and facilities and/or those of their clients.
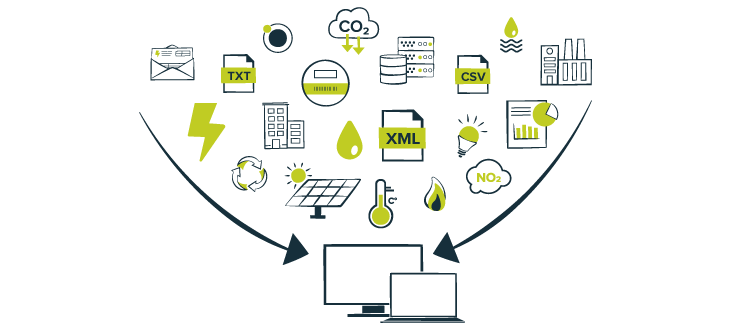
Buildings are a treasure trove of data. The sheer amount of data generated by buildings can easily overwhelm energy and sustainability professionals who don’t have the proper tools in place to streamline collection and centralize information from multiple sources.
Centralized data brings information together and helps make informed decisions when addressing operational inefficiencies, high utility costs, decarbonization, and other sustainability goals.
And while data is at the core of building sustainability, its collection and handling doesn’t have to be an all-consuming task. Energy and sustainability software tools can automatically collect and post data from utility bills, meters, sensors, files, databases, and repositories through various integration methods. This eliminates the need for manual readings and storage of data in spreadsheets, desktop files and other inadequate applications. Manual collection of data not only affects productivity and resources, but can be error-prone and lead to erroneous insights, distorted analyses, and ill-advised recommendations. The possibility for error is multiplied when attempting to scale energy management and sustainability projects for a growing number of buildings and facilities the manual way.
Energy and sustainability software automates data collection, turns raw data into dynamic graphs, charts and reports, and helps energy and sustainability professionals analyze their operations at the click of a mouse. A workflow that would take days in spreadsheets.
Regardless of the frequency, source, and types of data integrated, it’s important to choose software compatible with a variety of data integration mechanisms—especially ones that work for particular datasets but not others. This feature is an energy and sustainability manager’s best friend, especially as the volume and variation of data inputs increase, necessitating flexibility, scalability, and automation in the collection and handling of data.
How can EnergyCAP help?
EnergyCAP Utility Management replaces the need for cumbersome manual process and spreadsheets and automates data collection and analysis. A key element to the success of the solution is the ability to integrate data streams from a variety of data collection systems, files, and repositories in a streamlined manner. When it comes to utility bill data import and processing and management, EnergyCAP Utility Management sets the bar in employing best-in-class utility bill management technologies. All important bill charges and line-item details are captured and accounted for, eliminating the need for manual bill data management.
With the acquisition of Wattics, EnergyCAP’s energy and sustainability software now supports a large portfolio of data integration mechanisms and ensures that all data collected at customer’ sites is seamlessly incorporated with industry-standard communication interfaces (e.g., API, CSV to FTP, MQTT etc.) Data can be collected and monitored in varied granularity–from monthly readings, to daily, hourly, every 30, 15 or 5 minutes. Key to setting proper baselines, tracking trends, improvements and behaviors over time is the import of historical data, enabling you to identify past errors to make better judgment in the future. Through its data collection features and capabilities, EnergyCAP Smart Analytics (formerly Wattics) helps energy and sustainability managers and analysts cut 80–90% of the time spent on repetitive data collecting and handling tasks, so that they can focus on analyzing data.
Whether there are disclosure reports due; or budgets and forecasts that need to be put together; or performance data that must be submitted to rating agencies for certification; not having the data at hand to execute these tasks is a huge inconvenience and frustration. It can also lead to evaluations of buildings that lack transparency and aren’t an accurate reflection of their performance.
Buildings are complex, interconnected systems in which hundreds of processes and functions often impact one another. One example is heating and cooling, which has an impact on indoor temperature, air quality, and occupant comfort. Or an increase in floor size or hours of operation impacting energy consumption and other resources, such as water and raw materials. This has an impact on the sustainability of a building or business’s operations.
These examples demonstrate the domino effect of one system function or process on another. Building functions and processes don’t operate in isolation, meaning that they can’t be monitored and analyzed in isolation. This is why it’s important for the selected software solution to:
There are many solutions available that focus on niche aspects of the transition to sustainable buildings, such as occupant health and safety or GHG emissions tracking, demand response, energy accounting, certification and so on. However, for business and building owners concerned with their organization’s longevity, competitiveness, bottom line, and the value of their building assets—particularly from an environmental compliance perspective—it is imperative to have a robust solution that can examine critical factors from a holistic, big picture point of view.
Be sure that you select a software capable of monitoring and tracking a wide array of data types and metrics. The platform should serve as a single source of truth for all teams to maintain high-performing, cost-effective, resource-efficient, compliant operations and facilities.
How can EnergyCAP help?
EnergyCAP’s energy and sustainability software is the single source of truth for data collection, analysis, and reporting for energy, sustainability and decarbonization projects across multiple building types and industries. You can create, verify, and track the progress of the energy management projects, convert greenhouse gas emissions, and track water, waste, miles flown, and other data types. EnergyCAP’s energy and sustainability software provides the tools and analytics to help you achieve your sustainability goals faster and spend your time on projects that matter.
Without the tools to combine and analyze different datasets, variables that negatively impact savings actions and behaviors could go unnoticed or unchanged—maintaining a cycle of inefficiency. Opportunities for optimum efficiency can be missed if looking at consumption values no deeper than face value.
The reduction of silos and the availability of a centralized view of all relevant project data affords you visibility to understand the full environmental impact of a business’s or building’s operations—a key point briefly introduced in feature #2.
The application of adjustment data allows you to carry out numerous analyses that quantifies the impact of external variables on consumption and track progress toward improved performance.
These analyses could include, for example:
One stand-out use case demonstrating the benefit of centralizing data, is the need for balancing the demands between energy efficiency and indoor air quality—particularly during the height of the Covid-19 pandemic. Energy and air quality have a direct impact on each other, most notably as they intersect in relation to HVAC systems in commercial and residential buildings. When looking to optimize facilities for both energy efficiency and air quality, one must consider the immense value of analyzing these datasets together, side by side. This helps to determine the most effective actions toward achieving an optimal energy efficiency-air quality balance i.e., maintaining good quality air indoors, and reducing instances of over-ventilation which could lead to higher air-conditioning costs. With an understanding of what’s driving inefficient energy consumption and poor air quality, building facility managers and engineers don’t have to think of energy efficiency and good indoor air quality as a trade-off.
A consolidated data set that is clean, consistent, and meets the needs of those working with the data is essential to identify the behaviors and operations that cause or contribute to grave inefficiencies and waste.
How can EnergyCAP help?
EnergyCAP Utility Management provides the data visualization and analysis tools that bring different data sets into the same graph or chart, enabling the creation, monitoring, and analysis of energy and sustainability performance KPIs and benchmarks. This gives you a method to group and rank your buildings by factors such as use or cost per student, hours of use, or production output, as well as targets set out by industry standard and certification bodies. These analyses can be carried out at building-level or meter/ device-level in real-time. With EnergyCAP Utility Management, you get an immediate overview of how your building portfolio is performing with the ability to dive into your data. This is particularly helpful where there is a sizable portfolio to manage, since scaling your analysis is made simple and painless.
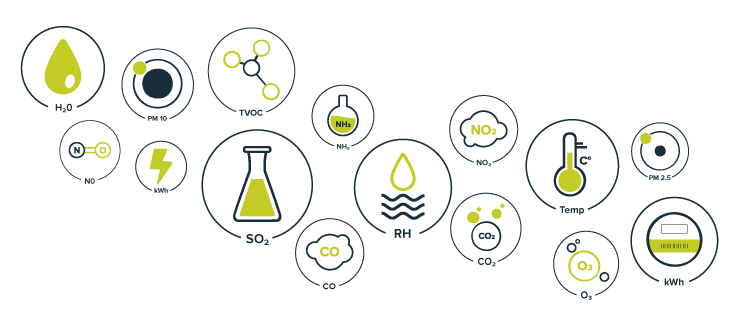
Additionally, with EnergyCAP Smart Analytics energy and air monitoring dashboard, you can monitor and analyze energy and air quality data in real-time, having kWh consumption and PM2.5, TVOC, temperature and other air quality parameters on the same graph/ chart. This helps you to better understand how IAQ impacts HVAC operation, and vice versa, to make well-informed, data-backed decisions toward achieving the optimal balance between HVAC energy efficiency and acceptable indoor air quality levels. The features built-in air quality thresholds per LEED, WELL and RESET standards so you can check how your facilities compare with leading industry standards. Through its TV display feature, you can also create customizable indoor displays. Monitor your facilities’ kWh and indoor air quality values as well as your buildings’ viral index, which calculates your facility’s potential for virus transmission indoors in real-time.
Data analyses performed by energy and sustainability managers traditionally involve complex modeling techniques and the application of mathematical formulas. Often done in Excel spreadsheets, these formulas calculate energy baselines, identify trends, and determine the impact of external variables such as degree days.
This is a time-consuming and ineffective process— collecting data from disparate sources and systems (the data is often rife with errors), manual entry into custom formats and charts, and expert-level knowledge of Excel functions.
Who has the time to go through a 5-step process to build a combination chart that displays the correlation between kWh and Cooling Degree Days (CDD)? Or spend an hour trying to figure out Excel’s regression capabilities in the hope of coming up with the equation that depicts the chiller input kW with varying chiller load?
If this sounds familiar, you’re not alone.
The truth is, these mathematical formulas are key to studying different data sets to determine whether any relationships exist between them. This is especially true for regression analysis, where formulas help establish metrics that determine if two simultaneous events are related in real-time or using historical data to identify insights that will facilitate their decision-making. Spreadsheet analysis is no longer a viable option for those who seek an intelligent, accurate, and scalable solution to analyze data.
Thanks to advances in software, you no longer need to spend time importing, exporting, and manipulating data, but can focus on what the data is telling you about your building, facility, or plant. Data can be analyzed more efficiently and effectively with robust analytics tools that eliminate the complexity and more importantly, the manual calculation of formula-based equations.
How can EnergyCAP help?
The EnergyCAP Utility Management has the tools that let you define virtual meters and dynamic graphs by applying formulas and conditions across real meters, data points, constants, and any numeric value. Energy and sustainability professionals no longer have to perform complex mathematical calculations in spreadsheets. EnergyCAP Utility Management eliminates the complexity and manual calculation of formula-based energy equations to achieve the insights needed in the decision-making process toward saving actions.
The proliferation of building data can be challenging for energy and sustainability professionals managing projects for large real-estate portfolios or businesses limited by their tools to scale data for monitoring, targeting, analysis, and reporting activities.
When dealing with incoming building data from multiple sources and facilities, tools that help organize, manage data, and visualize performance at the portfolio and device level is imperative.
Data visualization and bulk analytics
Energy and sustainability software provides sophisticated data visualization tools to create custom dashboards, graphs, and charts most relevant to you. You can spend less time sifting through multiple sources and view the data you want.
Software that contains bulk application features to scale KPI analysis and benchmarking makes it possible to duplicate actions across multiple buildings, meters, and devices. For example, the application of CO2 conversion factors for facilities within a hotel chain, or benchmarking water consumption to save water in schools or universities in drought-stricken districts. The major advantage here is that the application of KPI and benchmark data doesn’t become another manual process to contend with.
Machine-learning and alarms
Another advanced feature that assists in scaling analysis of building performance is the ability to track abnormalities and savings through the creation of alerts and alarms. Alarms negate the need to conduct individual analysis of buildings within a portfolio. Machine-learning, another transformative technology, learns building and device-level over time, flagging irregularities and oddities automatically based on historical trends.
Automated Reporting and Compliance
Apart from data collection covered earlier, reporting is another area that can consume hours of time if not automated. Apart from the immense time-saving benefit, automation increases data reliability and accuracy and facilitates the timely delivery of energy and sustainability reports. This is a necessity when managing the reporting process for hundreds of buildings and/or commercial and industrial customers who rely on access to consistent, error-free reports to make well-informed decisions. Report reliability, accuracy, completeness, and timeliness apply too for compliance with ESG disclosures and certifications related to building energy efficiency and sustainability. Software solution providers increasingly recognize the value of developing mechanisms that allow automated reporting of data to certification bodies relevant to their customers. This presents a huge ease-of-reporting advantage for businesses and property owners seeking to align their performance and demonstrate compliance with carbon reporting mandates, as well as other energy management and sustainability standards and certifications.
How can EnergyCAP help?
EnergyCAP Utility Management helps energy and sustainability professionals to scale activities, displaying utility data as charts, graphs, and tables in highly configurable and informative reports. Each report is customizable using a wide variety of data filters, and you can build your own report library of saved and shared reports. Graphs, chart, and tables can be used to report requirements for ESG disclosure and rating systems, particularly when it comes to environmental and social performance. EnergyCAP’s integrations with industry standards such as LEED and ENERGY STAR Portfolio Manager simplify and speed up the certification process.
Other tools that assist in scaling performance monitoring include machine-learning technology that enables timely alerts to anomalous behaviors and track savings for numerous buildings and facilities–key to compliance with the ISO50001 energy management standard. Custom dashboards are another tool that you can use to bookmark and highlight KPI and other analyses pertinent to a specific project/building or tenant.
Finance leaders within an organization or business can use EnergyCAP Utility Management’s accounting feature to export verified bill details in a format that is import-ready for its specific accounting system. This workflow eliminates redundant data entry—ideally, all manual data entry—and ensures that your utility bills are audited and approved before they are paid.
Implementing an energy and sustainability software solution that enables transparency, visibility, and control when embarking on a new project or making buildings more sustainable is non-negotiable. Its value is irrefutable considering its role in improving the environmental impact of buildings. It results in a host of benefits, including reduced maintenance and operating costs, increased workplace productivity and occupant comfort, improved brand image, possibility for higher property valuation and rental income, tax credits and deductions, job creation and much more.
While the sophistication of the analysis capabilities may vary from solution to solution, the features listed above form the basic requirements to effectively manage building energy efficiency, and sustainability projects. As we inch closer to 2030 climate targets, energy and sustainability professionals need to be armed with the right tools to confidently drive decarbonization, resource and cost efficiencies for buildings and businesses across a myriad of industries. The survival of our natural ecosystems to serve future generations depend on it.