Have You Quantified Weather’s Impact on Your Utility Budget?
If you’re responsible for tracking energy use, you may have wondered about the impact of weather on your facility energy use. The good news is that if you have access to your utility bills, you don’t have to wonder any more. You can determine the impact of weather.
Only two variables are necessary to perform this mathematical calculation:
Meter energy use
Weather severity (as expressed using the degree day concept)
EnergyCAP energy management software uses a simple linear regression model to calculate weather sensitivity, but you can do the same thing by plotting the monthly consumption data vs. the total number of heating or cooling degree days for the same time period in a spreadsheet.
The approach can be visualized as a plot of the utility bills (dependent variable) for each calendar year, month-by-month, on a grid with consumption on the vertical axis and weather (the independent variable, as expressed using the “degree days” concept) on the horizontal axis. Here’s how it looks:
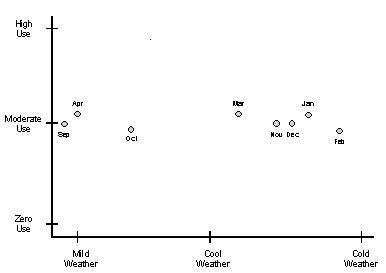
Example 1 – Not Weather Sensitive
Consider this raw plotted data from an electric meter in the winter. The X-axis is heating degree days and the Y-axis is energy used:
Each point represents an electric bill received in a winter month. The “best fit” line is found by statistical simple linear regression analysis, and is called the “regression line.”
For the charted data above, it is easy to see that the regression line would be horizontal. The meter uses about the same amount of electricity every month. This suggests that the meter is not weather-sensitive in winter, because the cold weather apparently has no effect on usage.
A line slope of “zero” means that the weather factor (amount of weather-related usage, expressed as KWH per degree day) would also be zero.
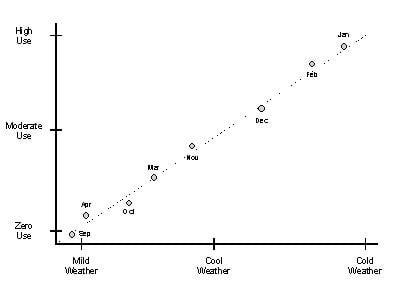
Example 2 – Highly Weather Sensitive
Consider this data from a gas meter in winter. This graph is very different. As the regression line makes clear, the usage increases as the weather gets colder, and decreases as the weather gets milder. Clearly, this meter is weather sensitive.
At the point of zero heating degrees (mild weather), the usage is zero. This means that the meter has no base load. There is no non-weather sensitive usage. All of the energy used is related to the weather. Let’s look at one more example:
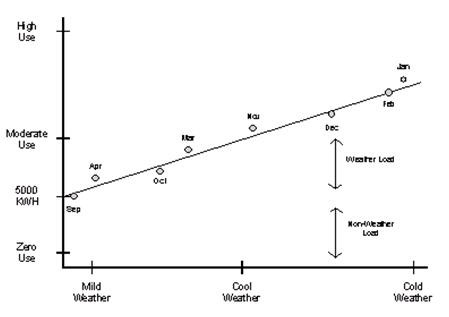
Example 3 – Partially Weather Sensitive
This winter utility data from an electric meter shows a consistent slope which rises to the right, so the meter is weather sensitive. In the cold months such as December, January, and February, the weather load (expressed as heating degree days) is greater, while in the mild months the weather load is smaller.
Note, however, that unlike the previous example, the Y-intercept (the point at which the regression line meets the vertical axis) has a value greater than zero, in this case about 5,000 KWH. The Y-intercept reveals the meter’s base load—the non-weather-related portion of the total usage. This meter uses 5,000 KWH even if there is mild weather (zero heating need degrees), plus some additional KWH depending on the weather.
The Application
Once you understand the weather sensitivity of your meters/buildings, you’re in a better position to anticipate weather-related expenses. You’re also in a better position to more accurately compare energy use from year to year, since it becomes possible to normalize year-to-year comparisons for weather. This enables you to obtain a more complete picture of the effectiveness of energy management initiatives.
{{cta(‘68750df6-4cf2-40a3-8932-2c00e195548b’)}}
<?
/******************************************************
TOP BOX HEADLINE
******************************************************/
?>
This website stores cookies on your computer. These cookies are used to collect information about how you interact with our website and allow us to remember you. We use this information in order to improve and customize your browsing experience and for analytics and metrics about our visitors both on this website and other media. For more information, read our Privacy Policy.
Functional
Always active
The technical storage or access is strictly necessary for the legitimate purpose of enabling the use of a specific service explicitly requested by the subscriber or user, or for the sole purpose of carrying out the transmission of a communication over an electronic communications network.
Preferences
The technical storage or access is necessary for the legitimate purpose of storing preferences that are not requested by the subscriber or user.
Statistics
The technical storage or access that is used exclusively for statistical purposes.The technical storage or access that is used exclusively for anonymous statistical purposes. Without a subpoena, voluntary compliance on the part of your Internet Service Provider, or additional records from a third party, information stored or retrieved for this purpose alone cannot usually be used to identify you.
Marketing
The technical storage or access is required to create user profiles to send advertising, or to track the user on a website or across several websites for similar marketing purposes.

 Best-in-class portfolio-level energy and utility bill data management and reporting.
  Real-time energy and sustainability analytics for high-performance, net-zero buildings.
  A holistic view of financial-grade scope 1, 2, and 3 carbon emissions data across your entire business.
  Energy and sustainability benchmarking compliance software designed for utilities.
  If you’re responsible for tracking energy use, you may have wondered about the impact of weather on your facility energy use. The good news is that if you have access to your utility bills, you don’t have to wonder any more. You can determine the impact of weather.