Interval Data: A Valuable Complement to Billing Data (Updated 5/20/21)
This blog was updated on May 20, 2021.
Over my two decades in the energy management software industry, I have spoken with many energy and facilities managers, and a common topic of conversation is the value of monthly utility bill data versus meter interval data for analysis. In most cases, my response is, “Do both.” Start with an analysis of billing data and refine your research and management with interval data.
The Value of Utility Bill Tracking
Starting with utility bill analysis makes sense for multiple reasons:
Utility bills are readily available, showing up like clockwork every month or quarter. No additional investment is required to get the data.
Each bill provides a lot of big-picture data regarding a facility’s energy consumption and cost. A great deal of value can be extracted from utility bill data, so it’s just good stewardship to use it.
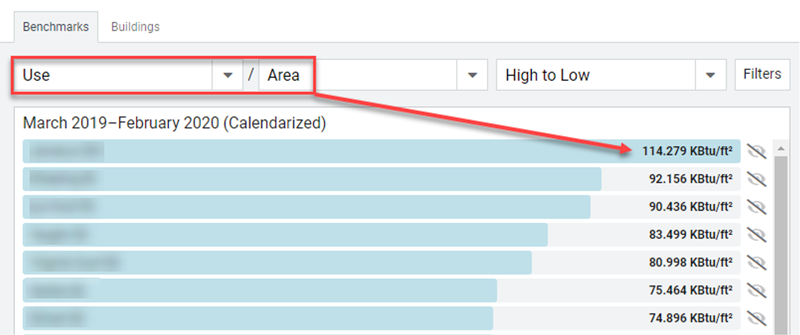
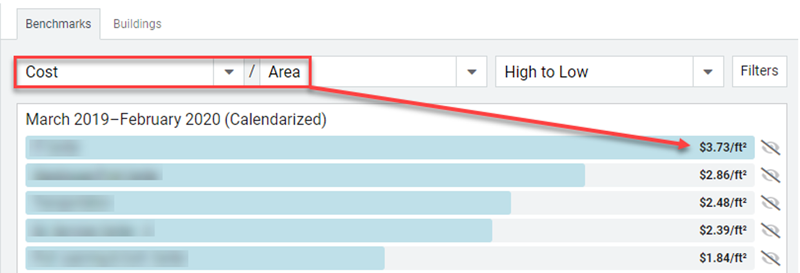
Implementing a utility bill analysis application is typically much easier and faster than purchasing, installing, and networking a metering system, and with a software application like EnergyCAP, you’ll be able to use that data to quickly identify which of your facilities are least energy efficient…
… and quite possibly most expensive on a per-area basis:
Depending on the application you use for utility bill tracking, you may also be able to catch billing errors and streamline your organization’s utility bill workflow process.
The Value of Interval Meter Data Tracking
After you’ve used utility bill data to identify your prime energy reduction targets, it’s time to get into the weeds to figure out why consumption or cost is so high, and that’s where interval data can come into play.
Interval data will enable you to answer a variety of building-level questions, including the following:
Is my building turning on at the expected time each day, or too early?
Are lights and other building systems setting back when they should be each evening and on weekends, or too late?
Are there any demand spikes that could be resulting in increased costs via ratchet rates or other tariff-related penalties? Can I “spread out” use of large equipment items to reduce the spikes?
If your 15-, 30-, or 60-minute interval data reveals an unexpected load profile – equipment running overnight, for example – adjustments to building systems may yield substantial energy and cost savings.
Peak demand charges can account for as much 40% of total energy chargesi, and interval data analysis can provide insight into correctable usage patterns.
Interval data can also deliver benefits beyond whole building performance analysis, such as:
Utility Bill Verification: Comparing the usage listed on your utility bill with usage recorded by metering system over the same time period is one way to confirm that accuracy of your utility bill.
Demand Response: Demand response programs provide financial incentives for organizations to reduce or shift energy (primarily electricity) use during periods of very high demand. Interval meter data will reflect the level of demand reduction achieved.
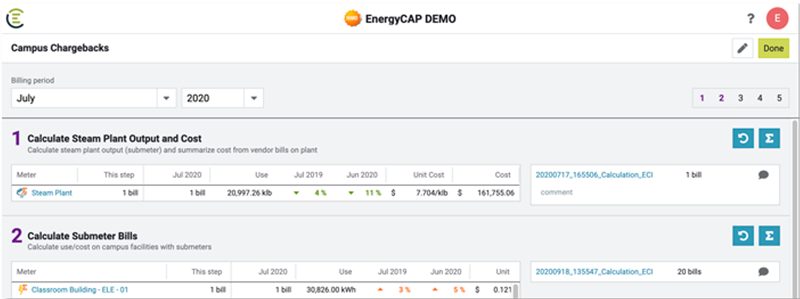
Chargeback Calculations: Many organizations use complex spreadsheets to allocate energy use and cost from a vendor master meter across multiple facilities or multiple building tenants. In the absence of interval data, calculations are commonly done on a percentage basis (e.g., percentage of total square footage). If the facilities or tenant spaces are submetered, interval data readings are automatically rolled-up to a total monthly consumption number, which is then be used for a more accurate chargeback calculation.
Equipment Performance: You can get as granular as you wish with interval data. You can submeter specific equipment items for on-going performance tracking or fault detection, or analyze interval data from a manufacturing process to determine per-widget energy consumption and cost. EnergyCAP report “AN22CC-Monthly Comparison by Production” can illustrate the value of production-related energy tracking.
Historically, organizations have obtained interval data by installing and maintaining their own submetering network. It’s typically an expensive, relatively complex, and often time-consuming process. However, the consumer is in control of where submeters are installed, what data is gathered, and how the data is used. And, ideally, the intelligence provided (and control gained) by having access to detailed energy consumption data will yield a rapid payback.
The Green Button initiative is a rapidly growing alternative to consumer-installed submetering networks. Per Energy.gov, “The Green Button initiative is an industry-led effort that responds to a White House call-to-action to provide utility customers with easy and secure access to their energy usage information in a consumer-friendly and computer-friendly format. Customers are able to securely download their own detailed energy usage with a simple click of a literal “Green Button” on electric utilities’ websites.” Via Green Button, organizations can access vendor-provided interval data in a common XML format.
More than 30 U.S. utility vendors have committed to the Green Button initiative to date. Check out http://energy.gov/data/green-button to see if your vendor is on the list.
EnergyCAP has a flexible import wizard that enables you to import files from any metering system, or we can manage the import process for you via our Smart CAPture service. Once in EnergyCAP, your interval data is available for detailed analysis, enabling you to identify costly demand issues.
As the use of smart meters and time-of-use tariffs expands, access to, and analysis of, interval data may be more and more important for energy and facilities managers. So audit your vendor bills carefully. Benchmark your facilities to identify the energy hogs using your monthly utility data. Then take and maintain control with interval data.
[1] “Beyond the Bill: Refining Your Energy Management Program with Interval Data,” Urjanet, Inc. October 2016.
This website stores cookies on your computer. These cookies are used to collect information about how you interact with our website and allow us to remember you. We use this information in order to improve and customize your browsing experience and for analytics and metrics about our visitors both on this website and other media. For more information, read our Privacy Policy.
Functional
Always active
The technical storage or access is strictly necessary for the legitimate purpose of enabling the use of a specific service explicitly requested by the subscriber or user, or for the sole purpose of carrying out the transmission of a communication over an electronic communications network.
Preferences
The technical storage or access is necessary for the legitimate purpose of storing preferences that are not requested by the subscriber or user.
Statistics
The technical storage or access that is used exclusively for statistical purposes.The technical storage or access that is used exclusively for anonymous statistical purposes. Without a subpoena, voluntary compliance on the part of your Internet Service Provider, or additional records from a third party, information stored or retrieved for this purpose alone cannot usually be used to identify you.
Marketing
The technical storage or access is required to create user profiles to send advertising, or to track the user on a website or across several websites for similar marketing purposes.

 Best-in-class portfolio-level energy and utility bill data management and reporting.
  Real-time energy and sustainability analytics for high-performance, net-zero buildings.
  A holistic view of financial-grade scope 1, 2, and 3 carbon emissions data across your entire business.
  Energy and sustainability benchmarking compliance software designed for utilities.