


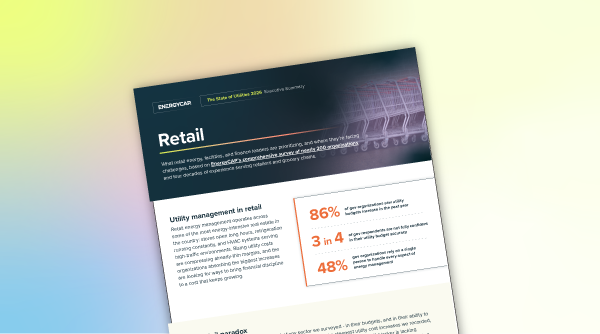
Retail energy teams are absorbing some of the steepest utility cost increases of any sector we surveyed, and doing it with some of the leanest energy management infrastructure in the industry....


Headquarters
EnergyCAP, LLC
360 Discovery Drive
Boalsburg, PA 16827
Denver, CO
Suite 500
5445 DTC Parkway
Greenwood Village, CO 80111
Dublin, Ireland
Unit F, The Digital Court, Rainsford Street,
Dublin 8, D08 R2YP, Ireland
Phone: 877.327.3702
Fax: 719.623.0577
“Data has a nasty way of representing the wrong idea when inaccurately reported.”
—Tony Rovano, AssetWorks
It’s your first year on the job as energy manager for a sizable regional real estate management firm. You’re proud of several new initiatives that you were able to implement, but as the summer drags on, you hear through the grapevine that the CEO has been receiving concerned memos from Accounting due to rising utility expenses.
Now your supervisor has threatened to pull the plug on a major lighting retrofit that you know will pay for itself in savings over the next three years. It looks like the honeymoon is over, but you are scratching your head to try to figure out what went wrong. It just isn’t fair.
More than likely, the problem is with your energy data. And it’s not that the data is necessarily wrong—just incomplete and/or out of context. Your CEO, and possibly Accounts Payable, just needs a lesson in normalization.
Here’s the problem: when comparing and trending facility energy use, you can’t just dump two years of use and cost utility data into a spreadsheet and expect to get a meaningful assessment of your energy management program. This is because there are a lot of variables that impact your utility use and cost data, and the energy manager controls only a few.
This is where normalization comes in. Normalization can determine those uncontrollable variables that impact energy use/cost, quantify them, and then remove them from the equation. The younger subject in our feature photo might have preferred to normalize for age in his height comparison!
When it comes to comparing utility datasets, normalization can give you a much clearer picture of the impact of your energy management efforts.
{{cta(‘ea6e206f-abfc-4e84-9a20-724ba9d37a90′,’justifycenter’)}}
So what sort of variables can cloud the data and obscure your energy management vision? There are five primary factors:
Weather—This is a big deal. Weather can profoundly impact energy use in winter and summer, but it’s a factor you cannot control. It wouldn’t be fair to fault your energy management program for a weather-created problem. Energy managers use the degree day concept to determine weather severity in summer months and in winter months. If the energy manager in our story was working in and around Phoenix, AZ, and his company’s accounting department was concerned about a 10 percent increase in 2015 utility costs over 2014, then they’re not playing fair. According to historical degree day data, August cooling degree days were up by 16 percent in 2015 in Phoenix. A mere 10 percent increase in use/cost could be a sign that the new energy manager is making a positive contribution to the company’s bottom line!
Billing Period Length—Some bean counters like to compare monthly utility bills, thinking that those bills are all equal. But they’re not. Some months are longer than others, and some billing periods are even longer than the months (or shorter)! It’s not fair to treat them all alike! So what’s an energy manager to do?
With EnergyCAP, billing data can be automatically calendarized. Behind the scenes, EnergyCAP breaks out the monthly energy use and cost into daily “buckets” that correspond to the amount of energy used each day of the billing period, with automatic adjustments based on the weather-sensitivity of each meter. Once we get the daily values, it’s a super-simple process to sum those values according to the calendar (instead of the arbitrary billing period determined by the meter reader), producing wonderfully-consistent year-to-year month-by-month calendarized reports.
Square Footage—If your facility portfolio is changing frequently, it becomes very important to keep the square footage numbers up-to-date for your conditioned spaces. In EnergyCAP, we include a logging feature that captures each square footage change for a facility, along with the date of change. Those values can be applied when reporting and calculating vital metrics such as use/sq. ft. or cost/sq. ft.
If the square footage of your building portfolio decreased by 25 percent and your energy bill stayed the same, it’s probably not fair to give the energy manager a bonus.
Production—In some market segments, such as manufacturing or hospitality, production factors can significantly influence energy use. How many kilowatts does it take to produce one widget? What is our electric use per room night? An EnergyCAP report (AN22CC), which tracks meters that are set up as production counters and calculates use per unit produced, could help you arrive at that number. Then you could normalize for production values to further refine your month-to-month and year-to-year energy efficiency comparisons.
Occupancy—There’s an energy management truism that buildings don’t use energy, people use energy. For energy managers who want to get a bit geekier, occupancy is a potentially significant normalizing factor. EnergyCAP’s new Report Designer has the capability of incorporating your own external data sources, so if you track occupancy by day or even by hour, you can crunch the numbers in Excel and meld your energy and occupancy data to gain new insights.
NOTE: If your building has typical 9-5 office hours, you may want to track smart meter interval data to get a more granular view of energy consumption, paying closer attention to building temperature setbacks. According to the U.S. Department of Energy, setting back the temperature 10 to 15 degrees Fahrenheit for eight hours a day can save roughly 10% on heating and cooling bills—up to 1% savings for every degree the temperature is turned back.
Since weather is often the largest variable affecting energy use, historical comparisons that have been “normalized” for weather can help provide a clearer picture of the effectiveness of energy management actions.
In EnergyCAP, calendarization provides the starting point for normalization, since the calendarization process takes raw billing data and allocates it to the most appropriate reporting calendar day and month. Calendarization also takes into account the weather sensitivity of each meter (see the Use vs. Weather topic in our HELP documentation for more information).
Normalization takes calendarization a step further by actually applying month-by-month weather conditions from a user-selected calendar normalization year to the comparison year.
More specifically, the weather-sensitive usage value from the base year is applied to the mathematical ‘model’ of weather-sensitivity for each of the comparison years. The recalculated weather-sensitive monthly usage is added to the non-weather-sensitive monthly usage (base load) to produce a monthly data point on a line graph.
For example, if the 2011 normalized energy use for a building is lower than the normalized 2009 energy use, it can be certain that the reduction is not due simply to milder weather in 2011, since the consumption data for both years has already been weather-adjusted to the comparison weather year. Any differences could be attributable to energy management efforts or other factors, such as occupancy, production, square footage or equipment changes, or hours of operation. But the primary normalization factor of weather is no longer a variable.
What are your significant normalization challenges and solutions? Leave a Comment (below) and let us know!
{{cta(‘c74179b0-1a80-4b44-ab2c-ace6d7ccebe4′,’justifycenter’)}}