ENERGY STAR has recently released DataTrends—a sector-specific research and analysis series. The series currently includes 2-page fact sheets for each of 16 building types that are commonly tracked and rated using the DOE’s Portfolio Manager online software. In this blog, we will answer a few basic questions and make a couple of observations about the available data.
What are the Building Types that are discussed in DataTrends?
There are currently 16 included building types, which are:
Distribution Center
Non-Refrigerated Warehouse
Worship Facility
K12 School
Dorms/Residence Halls
Courthouse
Office (General)
Hotel
Retail Store
Senior Care Facility
Financial Office
Medical Office
Bank Branch
Hospital
Supermarket
Wastewater Treatment Plant
What are the primary property characteristics that are included?
Property characteristics vary by building type, but common characteristics include:
Square Footage
Weekly Operating Hours
Workers / 1,000 sq. ft.
Computers / 1,000 sq. ft.
Heating Degree Days
Cooling Degree Days
Each fact sheet provides a value for the 5th percentile, the median, and the 95th percentile of the sample:
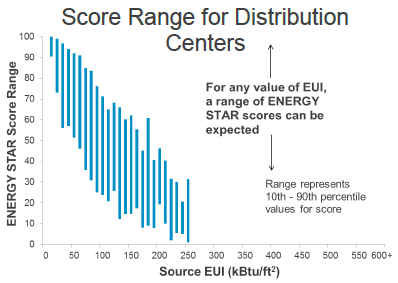
What energy data is available?
The fact sheets provide an ENERGY STAR score range comparison based on source Energy Use Index (EUI).
The EUI plus other variables affecting energy consumption are used to calculate your building’s ENERGY STAR rating.
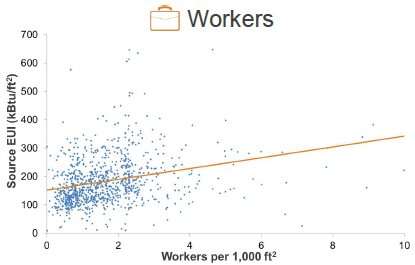
Source EUI is also compared with significant building variables using scatter charts.
Again, the provided data varies by building type. For instance, Dorms/Residence Halls include a scatter chart relating rooms/1,000 sq. ft. to Source EUI (no correlation). The Courthouses building type includes a scatter chart relating the number of workers per 1,000 sq. ft. with the source EUI (marked correlation—see chart). Depending on the type of building, the scatter charts also demonstrate correlations with either heating degree days or cooling degree days and source EUI.
Where can I find the DataTrends studies online?
The individual and collected datasheets are available on the ENERGY STAR website (click to view). If you’re curious about how your buildings stack up against national benchmarks, we encourage you to explore the Portfolio Manager DataTrends resources. According to DataTrends, buildings that consistently benchmark energy use save an average of 2.4 percent per year.
<?
/******************************************************
TOP BOX HEADLINE
******************************************************/
?>
This website stores cookies on your computer. These cookies are used to collect information about how you interact with our website and allow us to remember you. We use this information in order to improve and customize your browsing experience and for analytics and metrics about our visitors both on this website and other media. For more information, read our Privacy Policy.
Functional
Always active
The technical storage or access is strictly necessary for the legitimate purpose of enabling the use of a specific service explicitly requested by the subscriber or user, or for the sole purpose of carrying out the transmission of a communication over an electronic communications network.
Preferences
The technical storage or access is necessary for the legitimate purpose of storing preferences that are not requested by the subscriber or user.
Statistics
The technical storage or access that is used exclusively for statistical purposes.The technical storage or access that is used exclusively for anonymous statistical purposes. Without a subpoena, voluntary compliance on the part of your Internet Service Provider, or additional records from a third party, information stored or retrieved for this purpose alone cannot usually be used to identify you.
Marketing
The technical storage or access is required to create user profiles to send advertising, or to track the user on a website or across several websites for similar marketing purposes.

 Best-in-class portfolio-level energy and utility bill data management and reporting.
  Real-time energy and sustainability analytics for high-performance, net-zero buildings.
  A holistic view of financial-grade scope 1, 2, and 3 carbon emissions data across your entire business.
  Energy and sustainability benchmarking compliance software designed for utilities.
 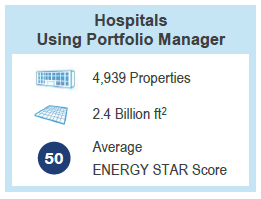 ENERGY STAR has recently released DataTrends—a sector-specific research and analysis series. The series currently includes 2-page fact sheets for each of 16 building types that are commonly tracked and rated using the DOE’s Portfolio Manager online software. In this blog, we will answer a few basic questions and make a couple of observations about the available data.
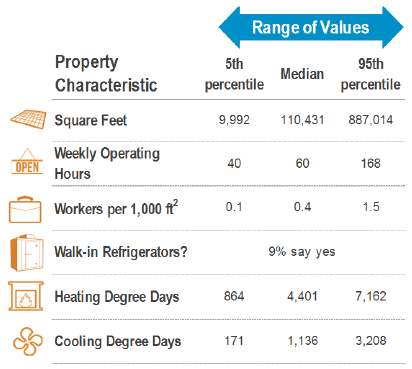
 The fact sheets provide an ENERGY STAR score range comparison based on source Energy Use Index (EUI).