


Utility bills are more than just monthly expenses. They’re a valuable source of data—but to make sense of it, you need to know what you’re looking at. Understanding each section of your bill h...


Headquarters
EnergyCAP, LLC
360 Discovery Drive
Boalsburg, PA 16827
Denver, CO
Suite 500
5445 DTC Parkway
Greenwood Village, CO 80111
Dublin, Ireland
Unit F, The Digital Court, Rainsford Street,
Dublin 8, D08 R2YP, Ireland
Phone: 877.327.3702
Fax: 719.623.0577
Water is often taken for granted in the United States. Turn on a faucet, and clean, safe water flows out effortlessly. Flush a toilet or run a dishwasher, and wastewater is efficiently carried away. Yet, behind this convenience lies a complex and aging infrastructure system that’s quietly reaching a tipping point. From its roots in colonial-era settlements to today’s sprawling systems of dams, pipes, and treatment plants, the history of water use in the U.S. mirrors the nation’s growth and industrial ambition. But with aging infrastructure, rising costs, and looming scarcity, this once-assumed abundance is fast becoming a costly burden.
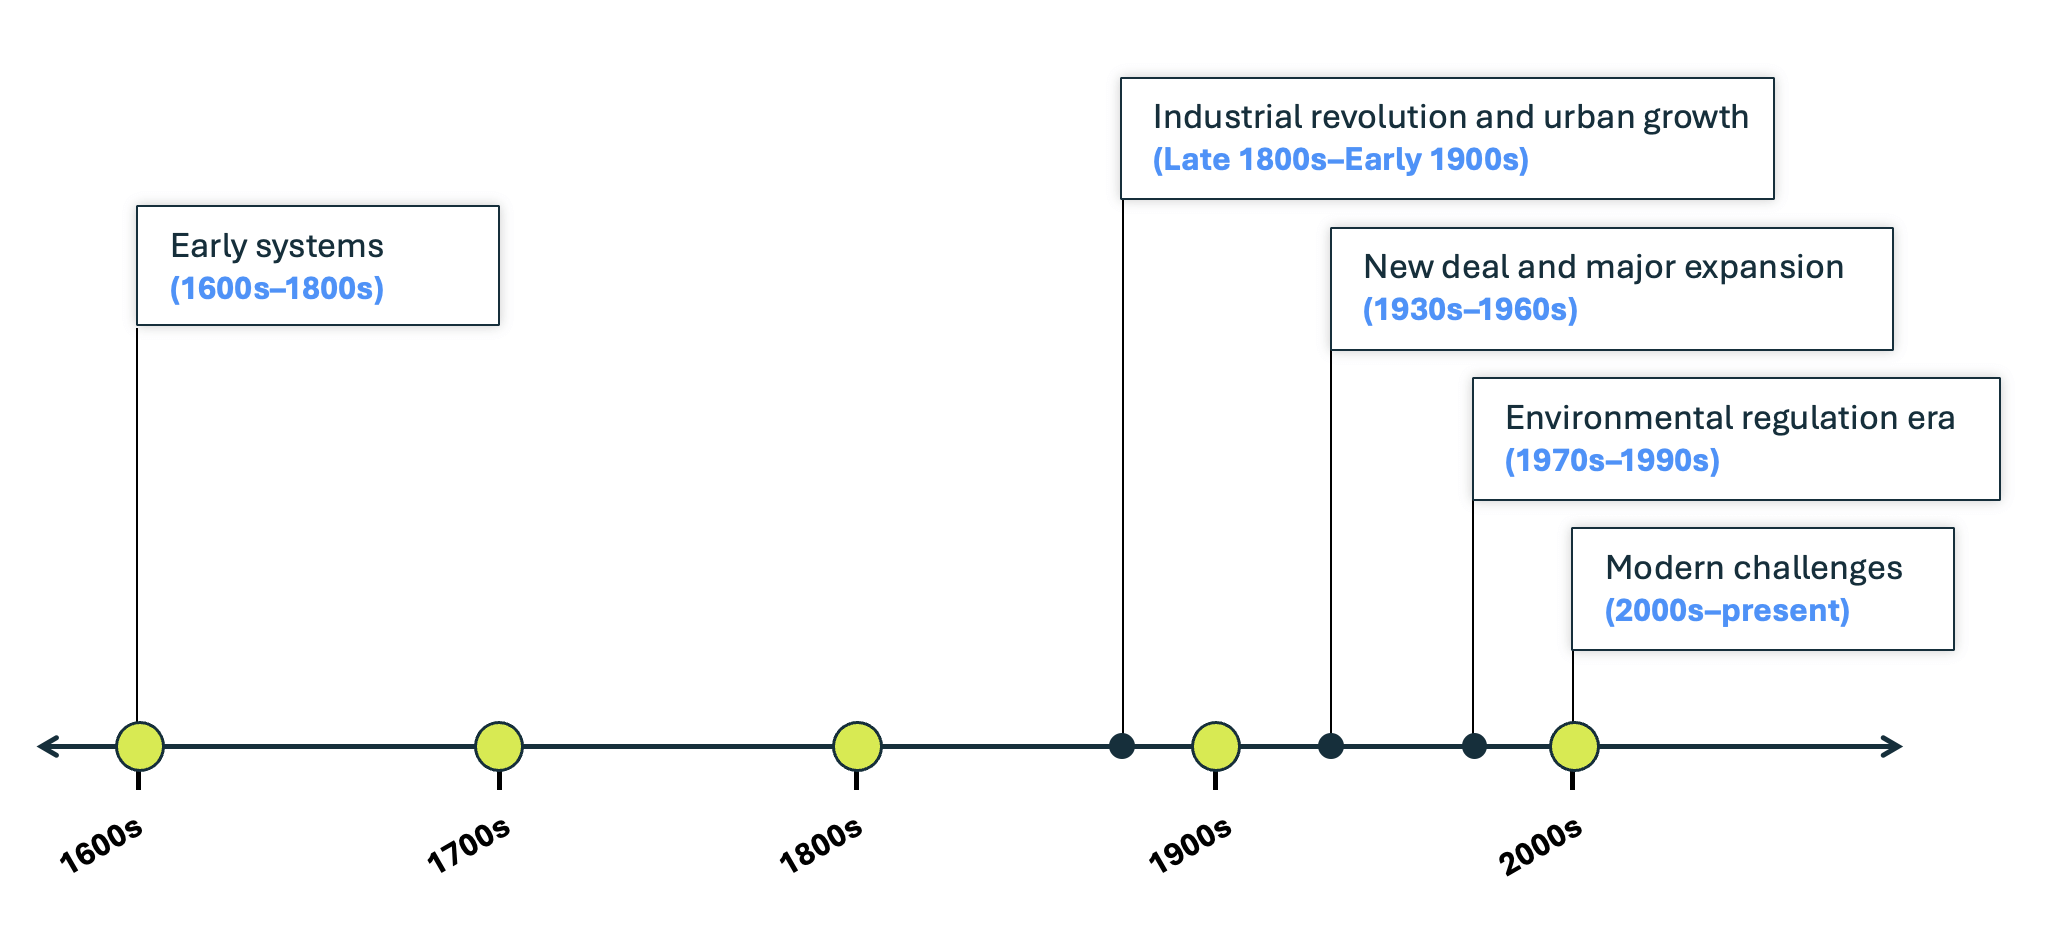
The story of water infrastructure in the United States begins in the 1600s and 1700s, when early settlers relied on wells, rain barrels, and nearby streams for their water needs. These rudimentary systems were functional but limited. By the 1800s, as cities grew and industrialization took hold, more sophisticated systems emerged. Cities like Philadelphia pioneered municipal water systems using wooden pipes and steam pumps.
The late 19th and early 20th centuries saw rapid urban growth and with it, the need for scalable infrastructure. Cast iron pipes replaced wood, and cities began to adopt chlorination and sand filtration, dramatically improving public health by reducing diseases like cholera and typhoid. The New Deal era of the 1930s brought massive federal investment into water infrastructure, funding dams, reservoirs, and pipelines that enabled urban and agricultural expansion.
By the mid-20th century, water infrastructure was seen as a symbol of American progress. The Clean Water Act of 1972 and the Safe Drinking Water Act of 1974 ushered in a new era of regulation and modernization. But the Golden Age of infrastructure investment faded, and much of the system built decades ago is now showing its age.
Today, many of the nation’s water systems are more than 50 years old. In cities like Philadelphia and Chicago, some pipes date back to the 1800s. The consequences are clear: the U.S. experiences an estimated 240,000 water main breaks each year, wasting over 6 billion gallons of treated water daily.
Needless to say, the issues aren’t just leaks and inefficiency. Aging infrastructure poses serious health risks, especially in places with lead service lines. The Environmental Protection Agency (EPA) estimates that the U.S. needs more than $625 billion over the next two decades to maintain and improve drinking water and wastewater systems. Without major investments, the system risks becoming not only unreliable but unsafe.
The consequences are clear: the U.S. experiences an estimated 240,000 water main breaks each year, wasting over 6 billion gallons of treated water daily.
Water and sewer services in the U.S. are primarily funded by local ratepayers. As infrastructure ages and repair costs rise, so do the bills. As of 2024, the average combined monthly water and sewer bill for a typical household is around $95, though this varies widely by region.
In cities like San Francisco and Boston, monthly bills can exceed $120. Seattle’s sewer charges alone average over $170 per month, driven by complex treatment needs and infrastructure costs. On the flip side, cities like Milwaukee and Phoenix maintain some of the lowest average bills, around $60–70 monthly.
Regional differences also reflect disparities in infrastructure age, treatment requirements, and water source availability. The Northeast, with its older systems, often sees higher costs, while the South and Midwest can be more affordable—at least for now.
In the coming weeks, we plan to break down regional or state costs to provide more visibility into cost disparities. Follow us on LinkedIn if you are interested in that deeper dive. You can also sign up for email updates from us here.
Driven by a mix of infrastructure upgrades, climate change, and regulatory pressures, water and sewer rates are projected to continue rising. In the past five years alone, rates have increased by over 24%, and analysts expect annual increases of 4–5% to persist.
By 2045, the average monthly bill for hospitals, universities, or state campuses could more than double if current trends continue. Buildings in drought-prone or infrastructure-challenged regions may see even steeper hikes. Climate change adds further complexity, increasing the cost of sourcing, storing, and treating water amid more frequent droughts and floods.
There are also growing concerns about affordability. The EPA sets a threshold of 4.5% of median household income as a benchmark for affordability. In many low-income communities, water bills already exceed this level, raising concerns about equity and access.
Funding the necessary upgrades will require a multi-pronged approach. Currently, local ratepayers (consumer and business sectors including hospitals, higher education, commercial retail and more) cover the majority of infrastructure costs through monthly bills. But this model is reaching its limits, especially in economically disadvantaged areas.
Federal support, which once covered more than 60% of infrastructure spending, now contributes less than 10%. However, recent initiatives like the Bipartisan Infrastructure Law (BIL) signed in 2021 have earmarked $55 billion for water projects, including lead pipe replacement and PFAS remediation. Programs like the EPA’s State Revolving Funds and the WIFIA loan program are also helping to finance large-scale projects.
State and municipal governments are issuing bonds and matching federal grants, while some utilities are exploring public-private partnerships to leverage private capital. Non-profit and philanthropic organizations are increasingly stepping in to support water equity and resilience projects.
Still, a significant funding gap remains. The American Society of Civil Engineers warns of a $400 billion shortfall if investment does not scale up. This gap could lead to even higher rates, service disruptions, and widening inequality in water access.
As utilities and municipalities face growing financial and operational pressure to modernize aging water systems, effective resource management becomes essential. This is where tools like EnergyCAP play a transformative role.
1. Data-driven water use management
EnergyCAP enables organizations to monitor, analyze, and benchmark water consumption across facilities, campuses, or municipal portfolios. By identifying trends, leaks, and anomalies in usage data, utilities and large water users can catch inefficiencies early—reducing both waste and operating costs.
2. Utility bill tracking and cost forecasting
With water and sewer rates expected to rise significantly; forecasting and budgeting tools are critical. EnergyCAP helps users understand historical cost patterns, project future expenses under different rate scenarios, and evaluate the financial impact of infrastructure upgrades or conservation initiatives.
3. Regulatory compliance and reporting
As federal and state regulations evolve—particularly around lead service lines, PFAS, and conservation targets—EnergyCAP streamlines reporting and documentation. It helps ensure compliance and supports transparency with stakeholders.
4. Capital planning and ROI analysis
EnergyCAP’s cost tracking features support utilities and local governments in making data-informed decisions about where to prioritize infrastructure investment. Whether replacing aging pipes, installing smart meters, or implementing water reuse systems, building and utility managers can track ROI and justify funding requests.
5. Integrated Resource Management–EnergyCAP covers more than water
Because EnergyCAP manages data for multiple utilities—electricity, natural gas, water, and more—it enables a holistic approach to infrastructure planning, particularly in the context of climate resilience, cost management and carbon tracking.
In short, EnergyCAP doesn’t just track water use—it empowers users to manage it more intelligently, helping bridge the gap between aging infrastructure and a more sustainable, affordable, and equitable water future.
The United States built one of the world’s most impressive water infrastructure systems—but it is now at a crossroads. Decades of underinvestment, combined with new environmental and demographic pressures, are transforming water from an inexpensive, abundant utility into a costly and complex public service.
The next 20 years will be critical. Policymakers, utilities, and communities must confront hard questions: How do we balance necessary investments with affordability? Who bears the burden—and who is left behind? Will we reimagine water as a shared public good, or let it become a source of inequality and risk?
History shows that water infrastructure can be a powerful driver of public health, economic growth, and environmental protection. The challenge now is to ensure that it continues to serve those goals in a new era of uncertainty and change.
AXIOS Chicago, “Lead levels in 72 Illinois towns triggered alerts”
Blue Field Research, “U.S. Water and Sewer Bill Has Increased 24% in Five Years, Raising Affordability Concerns”
The Utility Expo, “Mid-Year U.S. Utility Infrastructure Outlook”
Water & Health Advisory Council, “Water Online: Tariff Trends: Utility Affordability In America”
Water Online, “Local Water Challenges Drive U.S. Water Utility Rates Up 4%”
Water Security Newswire, “The Urgency of Addressing America’s Aging Drinking Water Infrastructure”
Wikipedia, “California Water Plan”