For almost 15 years, WeatherDataDepot.com has been the go-to site for degree day reports and historical data.
What’s a degree day, you may ask? A degree day is what makes it three times more expensive to heat and cool a building in Dallas than in San Diego, even though both cities have the same average annual temperature of 64 degrees. To learn more, you can check out the FAQs.
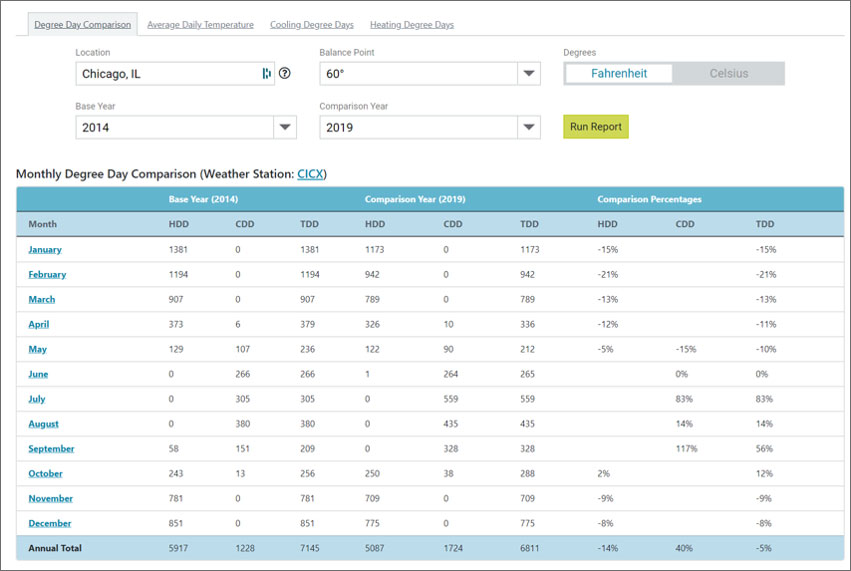
The all-new and always free WeatherDataDepot site features a year-to-year degree day comparison chart for easy explanation of why utility bills may vary from one year to the next.
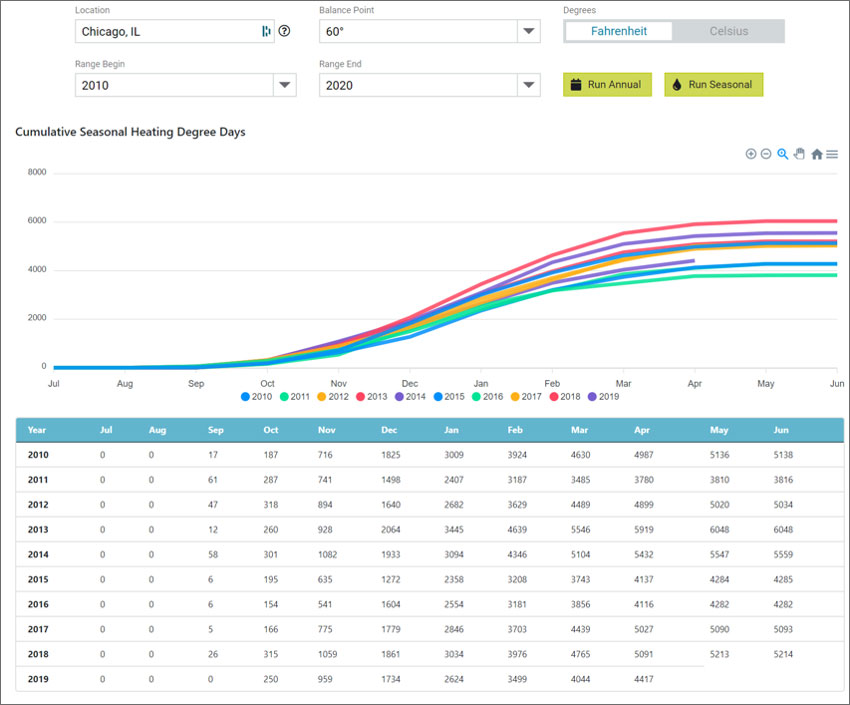
You’ll also find convenient cumulative cooling and heating degree day charts (downloadable) for up to a decade of data. Was this heating season average, milder, or more severe?
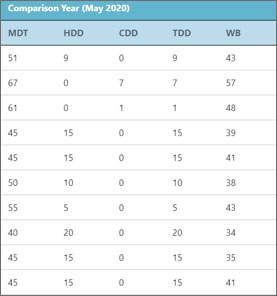
And, we’re happy to now offer daily wet bulb temperature! Wet bulb temperature is a great indicator of cooling loads because it embodies the physics of both air temperature and humidity. Wet bulb temperatures explain why a building in Orlando costs a lot more to air condition than a building in Phoenix, even though both cities have the same average annual temperature of 72 degrees.
If your important job responsibilities include analyzing, explaining, or reporting building energy usage, you’ll find WeatherDataDepot to be a great free tool!
<?
/******************************************************
TOP BOX HEADLINE
******************************************************/
?>
This website stores cookies on your computer. These cookies are used to collect information about how you interact with our website and allow us to remember you. We use this information in order to improve and customize your browsing experience and for analytics and metrics about our visitors both on this website and other media. For more information, read our Privacy Policy.
Functional
Always active
The technical storage or access is strictly necessary for the legitimate purpose of enabling the use of a specific service explicitly requested by the subscriber or user, or for the sole purpose of carrying out the transmission of a communication over an electronic communications network.
Preferences
The technical storage or access is necessary for the legitimate purpose of storing preferences that are not requested by the subscriber or user.
Statistics
The technical storage or access that is used exclusively for statistical purposes.The technical storage or access that is used exclusively for anonymous statistical purposes. Without a subpoena, voluntary compliance on the part of your Internet Service Provider, or additional records from a third party, information stored or retrieved for this purpose alone cannot usually be used to identify you.
Marketing
The technical storage or access is required to create user profiles to send advertising, or to track the user on a website or across several websites for similar marketing purposes.

 Best-in-class portfolio-level energy and utility bill data management and reporting.
  Real-time energy and sustainability analytics for high-performance, net-zero buildings.
  A holistic view of financial-grade scope 1, 2, and 3 carbon emissions data across your entire business.
  Energy and sustainability benchmarking compliance software designed for utilities.