


Utility costs are rising, budgets are tightening, and forecasting accuracy has become something organizations can’t afford to get wrong. According to EnergyCAP’s State of Utilities...


Headquarters
EnergyCAP, LLC
360 Discovery Drive
Boalsburg, PA 16827
Denver, CO
Suite 500
5445 DTC Parkway
Greenwood Village, CO 80111
Dublin, Ireland
Unit F, The Digital Court, Rainsford Street,
Dublin 8, D08 R2YP, Ireland
Phone: 877.327.3702
Fax: 719.623.0577
Which is more valuable to an effective energy management program: utility bill data or interval data? The answer is that both are valuable and play a critical role in effective energy management. Utility bill data provides a beneficial, big picture view of energy use and cost, while interval data is much more granular and allows you to see how much energy is being consumed at specific times of the day.
Utility bill analysis makes sense for multiple reasons. First, utility bills are readily available, showing up like clockwork every month or quarter. No additional investment is required to get the data. Secondly, each bill provides a lot of big-picture data regarding a facility’s energy consumption and cost. A great deal of value can be extracted from utility bill data, so it’s just good stewardship to use it. Thirdly, implementing a utility bill management application is typically easier and faster than purchasing, installing, and networking a metering system. With an energy management SaaS platform, like EnergyCAP, you should realize a lot of benefit from streamlined bill processing, automated utility bill auditing and analysis, and comprehensive reporting.
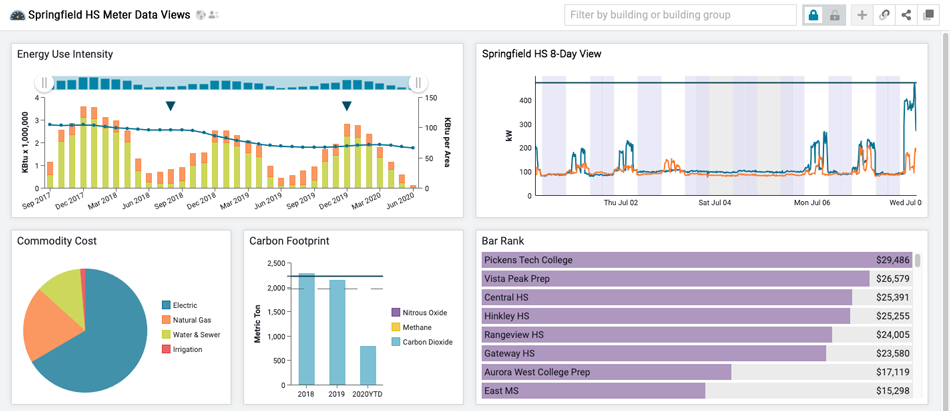
A competent SaaS platform will make it easy for you to benchmark peer facilities to quickly identify which of your facilities are least energy efficient…
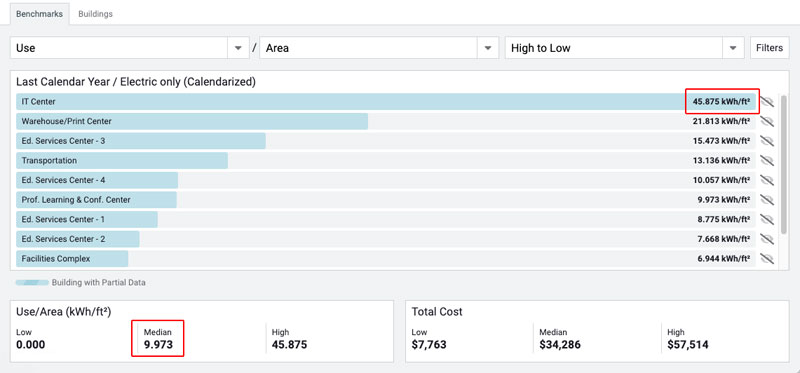
…and quite possibly most expensive on a per-area basis:
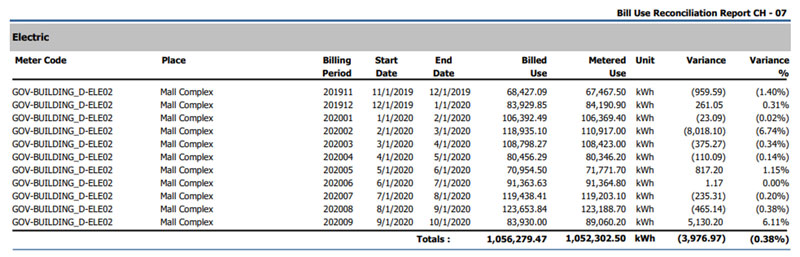
Your energy management platform should also help you catch billing errors and streamline your organization’s utility bill workflow process. For example, EnergyCAP Utility Management audits each utility bill as it is entered or imported and flags bills for data that is suspect. This process makes it easy to catch, research, and resolve billing issues before the bills are paid. Usage anomalies are also flagged and can alert the user to a potential metering or other issue before it becomes a long-term and costly problem.
Interval data documents the flow of fluid, gas, or other energy through pipes and wires and provides much more granular data than what is included on a utility bill. For example, a typical vendor bill provides a monthly measure of electric usage for an entire building. Interval data recorded by the vendor meter or a self-installed submeter records usage details in much smaller increments, such as every 15 minutes, enabling you to answer a variety of building-level questions, including the following:
1. Is my building turning on at the expected time each day?
2. Are lights and other building systems setting back when they should be each evening and on weekends?
3. Are there any demand spikes that could be resulting in increased costs via ratchet or other tariff-related penalties?
If your 15-, 30-, or 60-minute interval data reveals an unexpected load profile–equipment running overnight, for example–adjustments to building systems may yield substantial energy and cost savings. Peak demand charges can account for as much as 40% of total energy chargesi, and interval data analysis can provide insight into correctable usage patterns.
Interval data can also deliver benefits beyond whole building performance analysis, such as:
There are two primary sources for interval data: utility companies and a self-installed submeter network. Utility companies may make your interval data available for download, most likely in an XML or spreadsheet format, while others deliver interval data via the federal government’s Green Button program.
Per Energy.gov, “The Green Button initiative is an industry-led effort that responds to a White House call-to-action to provide utility customers with easy and secure access to their energy usage information in a consumer-friendly and computer-friendly format. Customers are able to securely download their own detailed energy usage with a simple click of a literal ‘Green Button’ on electric utilities’ websites.” Via Green Button, organizations can access vendor-provided interval data in a common XML format. More than 30 U.S. utility vendors have committed to the Green Button initiative to date. Check out https://energy.gov/data/green-button to see if your vendor is on the list.
The self-installed network approach is the most common interval data collection method. If you are considering heading in that direction, note that establishing the network typically requires a substantial monetary investment, can be relatively complex, and is often a time-consuming process. That said, you are then in control of where submeters are installed, what data is gathered, and how the data is used. And, ideally, the intelligence provided (and control gained) by having access to detailed energy consumption data will yield a rapid payback.
In a publication titled, “The Short Guide to Energy and Submetering (2019),” the Washington State University Energy Program provides the following advice regarding submeter installation:
“Before selecting and installing a submeter, it is important to have clear goals and create a submetering plan. Examples of goals include reducing the overall carbon footprint and energy consumption of a building, verifying savings from a lighting retrofit, isolating energy costs in a tenant-used space, and troubleshooting HVAC system problems. These goals help determine the output data needed, and type and cost of submeter and other devices.”
The Guide also outlines helpful “best practices and strategies” for implementing submeters:
|
|
After you have identified the source(s) of your interval data, there are still some critical questions to be answered: Where will the interval data be stored? How will the data be analyzed? How will the data get from the source and into my analysis tool? Ideally, the software you use to audit and analyze your utility bills also offers interval data import and analysis functionality, which answers the first two questions. You then just need to implement the data export (from the source) and import (into the software) process.
Begin the data-sharing process by clarifying your energy management platform’s interval data format requirements. EnergyCAP Utility Management, for example, requires three data fields for each interval reading—timestamp, import ID, and value—and can import comma, tab, or space delimited text files. Acceptable data formats can vary among softwares.
It is possible that the data exported from your interval data source is of a format your energy management platform does not support. Green Button, for example, provides data in an XML format, while many utility vendors offer Excel (XLSX) spreadsheets. If your platform does not allow you to import the interval data in its native format, you may be able to reformat the data manually and then import it. Alternatively, your platform provider may provide a data reformatter application to automate the process. This service is frequently provided by EnergyCAP, LLCs (ENC) project engineers and software developers.
After the required data import format is confirmed, you can proceed to the actual import process. As with data reformatting, you may be able to import the interval data manually into your platform or, ideally, automate the import process via APIs (application programming interfaces). Your platform vendor may make APIs available so your organization can develop a meter data import interface, or the platform vendor may offer an interface development service. Meter data interfaces developed by EnergyCAP for EnergyCAP licensees automate the data import process and, when necessary, include data reformatting and error reporting as part of the workflow, so the entire process is hands-off for EnergyCAP users.
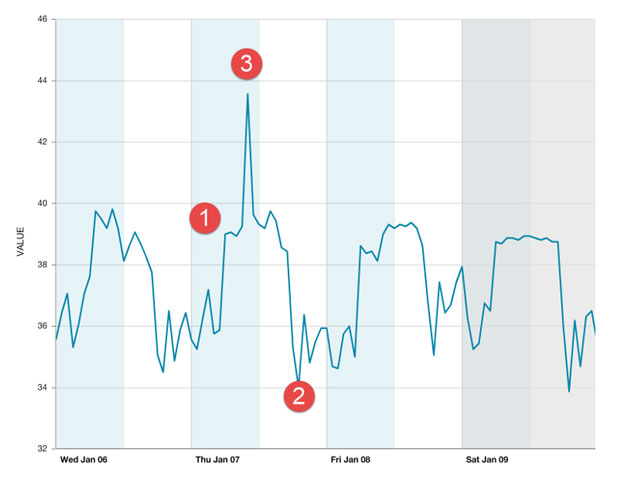
Smart meters and interval data play a vital role in conservation and effective, timely building operations. Below are interval data dashboard charts (Source: EnergyCAP) for two high school main electric meters. The gray line is the prior week when school was in session. The blue line is the first government-ordered pandemic shutdown week. Shaded areas are night times and weekends. White areas are weekdays, 6AM–6PM. As the energy manager, do you see anything that should have been checked?
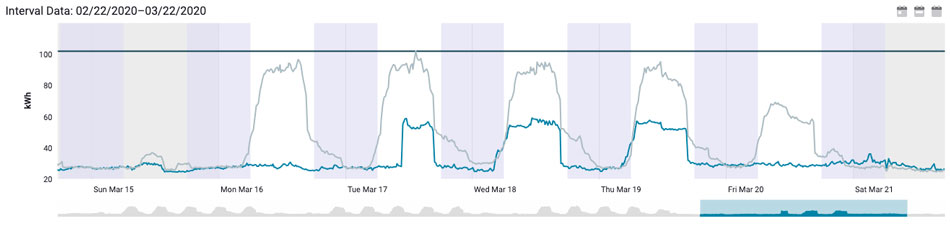
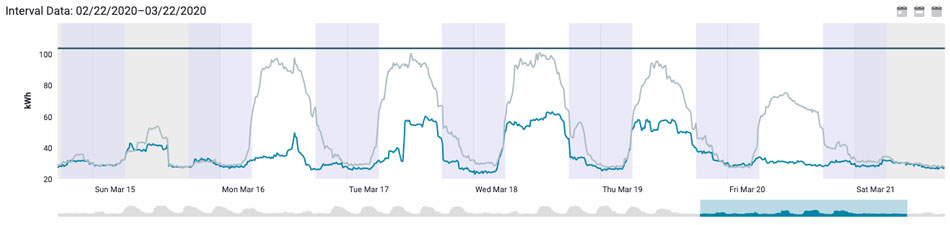
Here’s one: At High School #1, the March 16 and March 20 daytime shutdowns were terrific, right in line with the weekend shutdown load of a steady 100 kW. But what happened on March 17–19? Someone or something turned on an extra 150 kW for most of the day. High School #2 experienced about the same.
Even though the energy management staff were working from home, they could have logged in to their platform, seen the interval charts in near real time, and immediately investigated (via security cameras, EMS, phone calls), possibly saving a few hundred unnecessary kWs in just these two schools. At an average cost of 12 cents/kWh, that’s a daytime savings of about $1.50 per kW of reduction per day. Multiply that by thousands of excess kW across 50 buildings and perhaps months of planned shutdowns, and the savings quickly climbs to a substantial level.
Having easy access to interval data enables energy and building managers to take immediate action to correct suspected problems. Energy dashboards are often the easiest and most convenient way to share interval data with facility and energy managers:
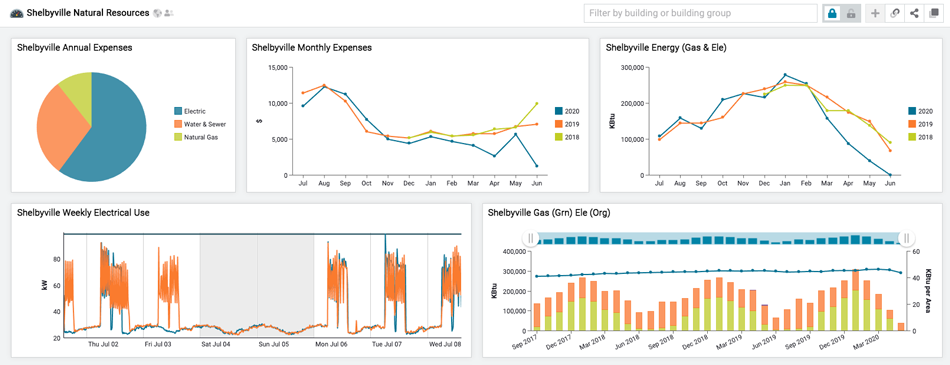
Assuming you’re using an energy management SaaS platform, your dashboards can be accessible from anywhere, and they provide near real-time data. The ability to create custom dashboards that allow the user to select the data to be displayed—all facilities, one facility, on or more specific meters or production lines, etc.—and determine the dashboard layout is an platform must-have.
As the use of smart meters and time-of-use tariffs expands, access to and analysis of interval data will become increasingly important for energy and facilities managers. So, audit your vendor bills carefully. Benchmark your facilities to identify the energy hogs using your monthly utility data. And get into the weeds and maintain control with interval data.