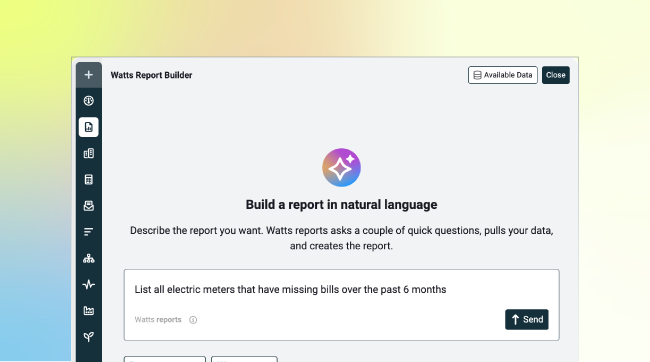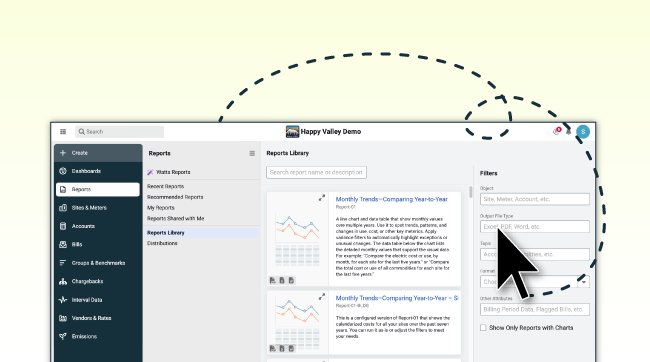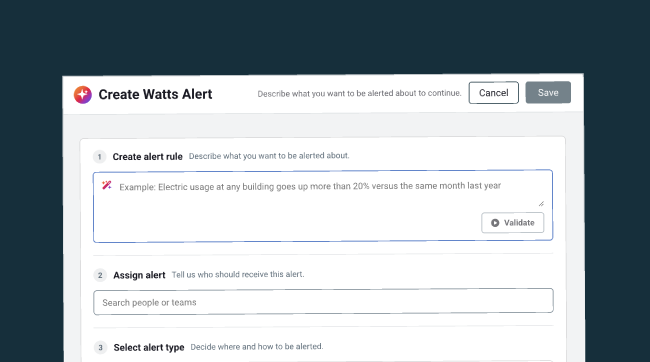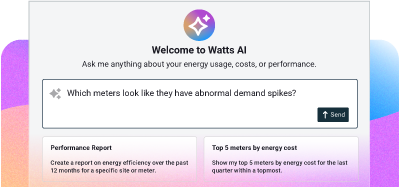






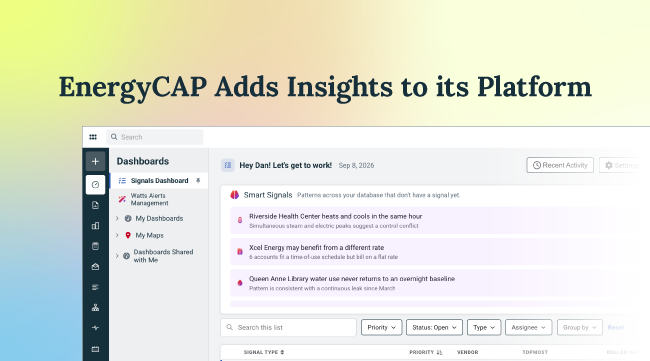
Orlando, Fl., September 15, 2026 — EnergyCAP®, the leading utility and energy management platform for public and private sector organizations, announced Insights, a new capability to their ene...



Headquarters
EnergyCAP, LLC
360 Discovery Drive
Boalsburg, PA 16827
Denver, CO
Suite 500
5445 DTC Parkway
Greenwood Village, CO 80111
Dublin, Ireland
Unit F, The Digital Court, Rainsford Street,
Dublin 8, D08 R2YP, Ireland
Phone: 877.327.3702
Fax: 719.623.0577
Utility costs are rising, budgets are tightening, and forecasting accuracy has become something organizations can’t afford to get wrong. According to EnergyCAP’s State of Utilities 2026 report, utility spending is climbing across every industry, and many organizations are still working to connect utility data across facilities, energy, and finance teams.
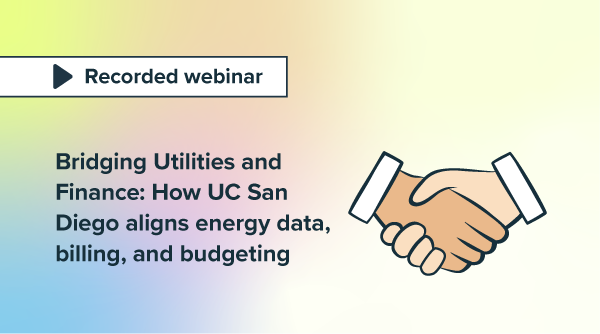
In a recent webinar, UC San Diego’s facilities and finance teams joined EnergyCAP to share how they closed exactly that gap. The university, which manages more than 750 buildings, three hospitals, and an $80 million annual utility budget, has worked from the same data, from the meter all the way to the general ledger, since adopting EnergyCAP. That partnership has changed what they’re able to catch and control.
A utility dollar starts as a number on a meter. Before it becomes something finance can budget against or defend in an audit, it usually passes through an operations or asset system, then a financial platform, picking up context, cost codes, and approvals along the way. For most large campuses, that’s a lot of ground to cover, and a lot of places for a number to lose accuracy along the way.
UC San Diego closed that gap by bringing usage data and financial data onto one platform. With EnergyCAP centralizing meter data, billing, and cost allocation, the university’s facilities and finance teams review the same numbers, rather than working from separate systems that only get compared when something looks wrong.

The three-step flow of utility data from the meter to EnergyCAP to the general ledger.
UC San Diego’s facilities and finance teams reconcile utility data together every month using EnergyCAP, and the catches have been real. One water bill came in at roughly $1 million against a typical month of about $32,000, a mistake on the vendor’s side of the meter. Because the university reviews every bill against prior usage before it’s approved, the team caught the variance right away, disputed the charge, and never paid it.
A second catch was quieter. A routine year-over-year cost comparison in EnergyCAP turned up a 187% jump in one month’s gas costs. Tracing it back pointed to a data problem, not an actual spike in usage. Because facilities and finance caught it together before the month closed, leadership got an explanation instead of a surprise, and the university avoided what could have been a roughly $2 million unexplained variance on the books.
Neither catch was obvious from one side alone. Finance saw the dollar amount. Facilities knew what the number should have been. Billing accuracy, in both cases, came from the two teams reviewing the same numbers, backed by a platform built to flag exactly this kind of variance.
Before adopting EnergyCAP, UC San Diego handled roughly 2,000 meter reads a month by hand, and utility bills typically took two months to move from usage to payment: May’s usage got billed in July. That’s a familiar starting point for large, complex campuses managing utilities the traditional way.
Today, that cycle takes a week. The role once dedicated to manual meter reading now spends most of its time on quality control and analysis. Recharge billing errors have dropped by close to 100%, and the university processes roughly 1,500 internal chargebacks a month across its campus, hospitals, and off-site clinics, on a $147 million annual recharge operation, all managed through EnergyCAP.
UC San Diego took automation further by building its own centralized reporting layer on top of that foundation, blending EnergyCAP data with its other operational and financial systems into one standardized view that updates as the underlying systems do. Departments that used to request custom reports in whatever format they wanted now pull consistent numbers themselves, and both operational and financial decisions get made from the same source.
UC San Diego’s finance team puts the stakes simply: if you can’t rely on your utility data, you can’t fully rely on your financial data either. That gets harder to ignore as rising costs and tightening budgets increase the scrutiny on every dollar.
EnergyCAP’s State of Utilities 2026 report, which surveyed more than 200 energy, facilities, and finance professionals, backs that up. Utility costs are rising for the large majority of organizations, controlling that spend is the top overall goal, and spend-versus-budget variance is the most common KPI teams are held to. Forecasting confidence is the gap: four in ten respondents said they aren’t fully confident in their own numbers.
UC San Diego’s experience suggests that confidence comes from facilities and finance working off the same reconciled numbers, consistently, long before anyone has to explain a variance.
Spreadsheets and disconnected workflows can carry an organization for a while. They get harder to sustain as utility costs climb and the questions from leadership get more specific. UC San Diego’s experience points toward a more proactive, data-driven approach to utility management, one where facilities and finance share the same numbers well before anyone needs to explain a variance. That shift supports both the operational efficiency facilities teams are judged on and the financial confidence finance teams need to deliver.
Watch the full webinar recordingBecause that’s the path every utility dollar takes before it shows up in a budget, a forecast, or an audit. If usage data and financial data are tracked separately, the numbers that reach the ledger reflect what was billed, not necessarily what was used, and errors go uncaught in the gap.
They start by reviewing the same numbers on the same schedule, usage, cost, and account activity, using one shared platform rather than separate systems that only get compared when something looks wrong. That shared review is what surfaces billing errors and unusual variances before they post.
Centralizing utility data, with a platform like EnergyCAP, replaces manual, duplicate reporting with one consistent source that both operational and financial teams pull from. That cuts the labor spent gathering and reformatting data and gives both sides the same numbers to make decisions against.