


EnergyCAP® offers energy managers a sobering question worth asking: how much did your team find out about last month’s cost spike? And when did you find out? For most teams, the answer i...


Headquarters
EnergyCAP, LLC
360 Discovery Drive
Boalsburg, PA 16827
Denver, CO
Suite 500
5445 DTC Parkway
Greenwood Village, CO 80111
Dublin, Ireland
Unit F, The Digital Court, Rainsford Street,
Dublin 8, D08 R2YP, Ireland
Phone: 877.327.3702
Fax: 719.623.0577
Rising infrastructure costs, climate impacts, and demand pressures are driving regional water rate increases across the U.S.—learn where costs are climbing fastest and how organizations can proactively manage the impact.
Learn moreThe U.S. is home to more than 148,000 public water systems nationwide. While this number might seem huge, most of these systems are quite small. More than 90% of community water systems serve fewer than 10,000 people, most fewer than 3,300 residents. These small but mighty systems are critical to rural and underserved areas, but often struggle with aging infrastructure and limited resources.
By contrast, very large systems (those serving 100,000 or more people) make up just 1% of community water systems. Though there are fewer of them, they serve the majority of Americans. These systems, often located in major metropolitan areas, are the backbone of the nation’s water infrastructure.
Approximately 600 very large community water systems operate across the U.S., supplying water to millions in urban centers like New York City and Los Angeles. These systems maintain extensive networks of treatment plants, reservoirs, pumping stations, and thousands of miles of water mains.
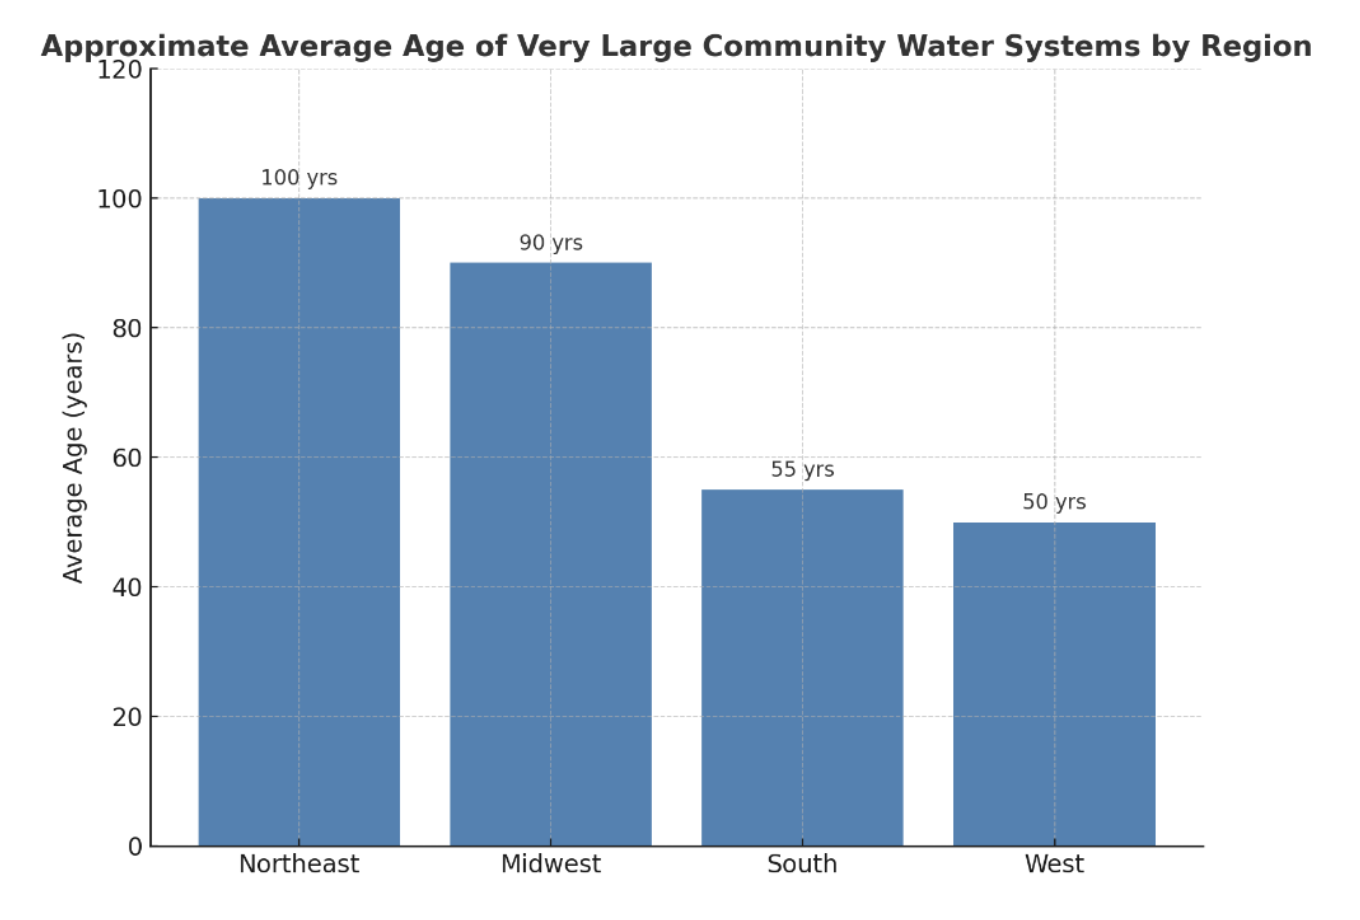
Challenges like climate change, population growth, and emerging contaminants including PFAS have made it difficult (and expensive) for large water systems to operate reliably 24/7. This is made even more difficult by the age of these pipelines. In the Northeast and Midwest water mains average between 90 and 100 years old, with infrastructure in the South and West a few decades newer.
Managing these aging pipelines has placed significant stress on the companies operating them. Massive upgrades and replacements, necessary for safety and operational continuity, all come with high price tags that are increasingly hitting ratepayer’s bills.
Water costs are on the rise nationwide. Here’s a quick look at projected regional trends over the next several years:
Cities like New York, Chicago, and Boston rely on some of the oldest infrastructure in the country, much of it dating back over 100 years. As a result, these regions saw the highest average sewer and water bills across the entire country last year, a trend that is unfortunately going to continue. Businesses in these areas can expect at least 5% annual rate increases driven by aging pipes and regulatory pressures.
The southern US is expected to account for nearly half of the nation’s total spend on water and wastewater infrastructure upgrades over the next decade. The benefits of newer pipes have been offset by rapid suburban expansion that is already fueling annual rate hikes of 6% or more, a number that will continue to rise over the next several years.
The effects of climate change have hit the western U.S. hard. Droughts, flooding, and wildfires have made water and sewer usage unpredictable and difficult to manage–forcing many cities to enact sweeping increases to water, electricity, and sewer prices. Buildings across the region can expect their water costs to rise at least 10% annually, in some cases tripling over the next five years.
As rates climb, concerns about affordability follow. The EPA sets a water affordability benchmark at 4.5% of median household income. With monthly water bills now equaling 20 hours of minimum-wage work in many cities, the burden will increasingly fall to large building owners to pay on time and in full to fill water and sewer company coffers.
Not interested in paying 30-300% more for your water in the next 5 years? There’s a lot building owners can do to stay ahead of escalating costs.
Water rates are rising—it’s not a question of if, but how steep and how soon. As large systems shoulder the burden of aging infrastructure and future demand, the need for clarity, control, and cost accountability has never been greater.
EnergyCAP gives utilities and organizations the insights they need to manage rate impacts, forecast with confidence, and make every dollar count.
Request a demo