


The deadline is real, and it’s a data problem The first SB253 Scope 1 and 2 disclosures are due this August. LL97 reporting windows are already live. Benchmarking and building-performanc...


Headquarters
EnergyCAP, LLC
360 Discovery Drive
Boalsburg, PA 16827
Denver, CO
Suite 500
5445 DTC Parkway
Greenwood Village, CO 80111
Dublin, Ireland
Unit F, The Digital Court, Rainsford Street,
Dublin 8, D08 R2YP, Ireland
Phone: 877.327.3702
Fax: 719.623.0577
As organizations manage their building portfolio, juggle energy data, and work to hit sustainability goals, getting the most out of their energy management tools is key. EnergyCAP simplifies complex energy and sustainability data in a single source of truth, cutting costs and energy use in the process. We hear from customers every day who are ditching spreadsheets and manual processes, making more informed choices, and saving big–whether that’s through lower energy bills, spotting billing errors, or fixing issues with their buildings.
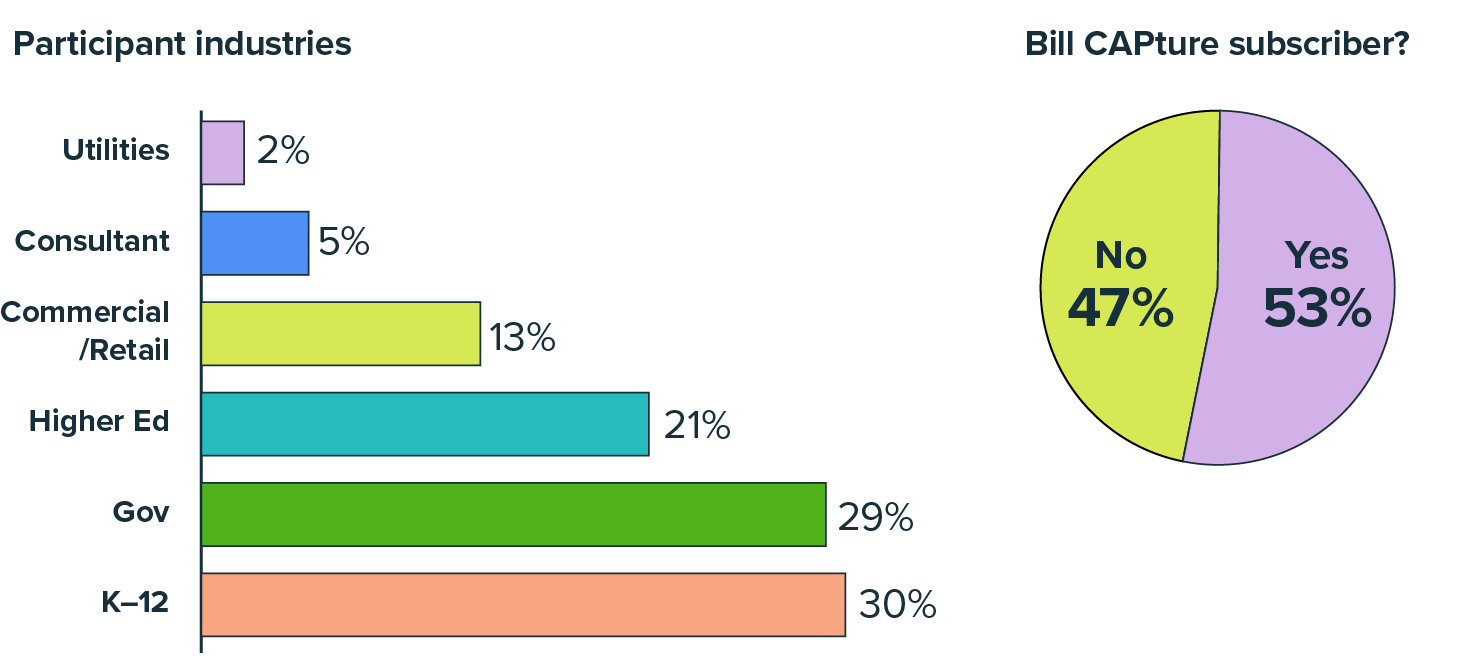
To measure and validate this impact we ran a survey with customers from a broad range of industries, asking them to share whether, and how much, they’ve saved in costs and time since they began using EnergyCAP Utility Management™ (EUM). Sharing the survey results is our way of showing you just how much value EnergyCAP brings to the table with a quick ROI, hefty cost savings, and more time on your hands.
After implementing EnergyCAP Utility Management, you can expect to:
The ROI of EnergyCAP Utility Management survey was open to all current EUM customers. If there were multiple responses from a single organization, additional responses were:
Excluded from the results if all submitted responses were identical.
The least favorable response was used if submitted responses differed (e.g. if one participant reported an ROI of 0–1 years, and another participant from the same organization reported an ROI of 2–3 years, the ROI for that organization was reported in the survey as 2–3 years.)
We crunched some numbers from our survey to provide clear benchmarks and takeaways in this eBook. Average, or mean, values are denoted with an * or clearly stated to be the average result. All other results are exactly what customers reported, transcribed directly into this eBook.
What we think
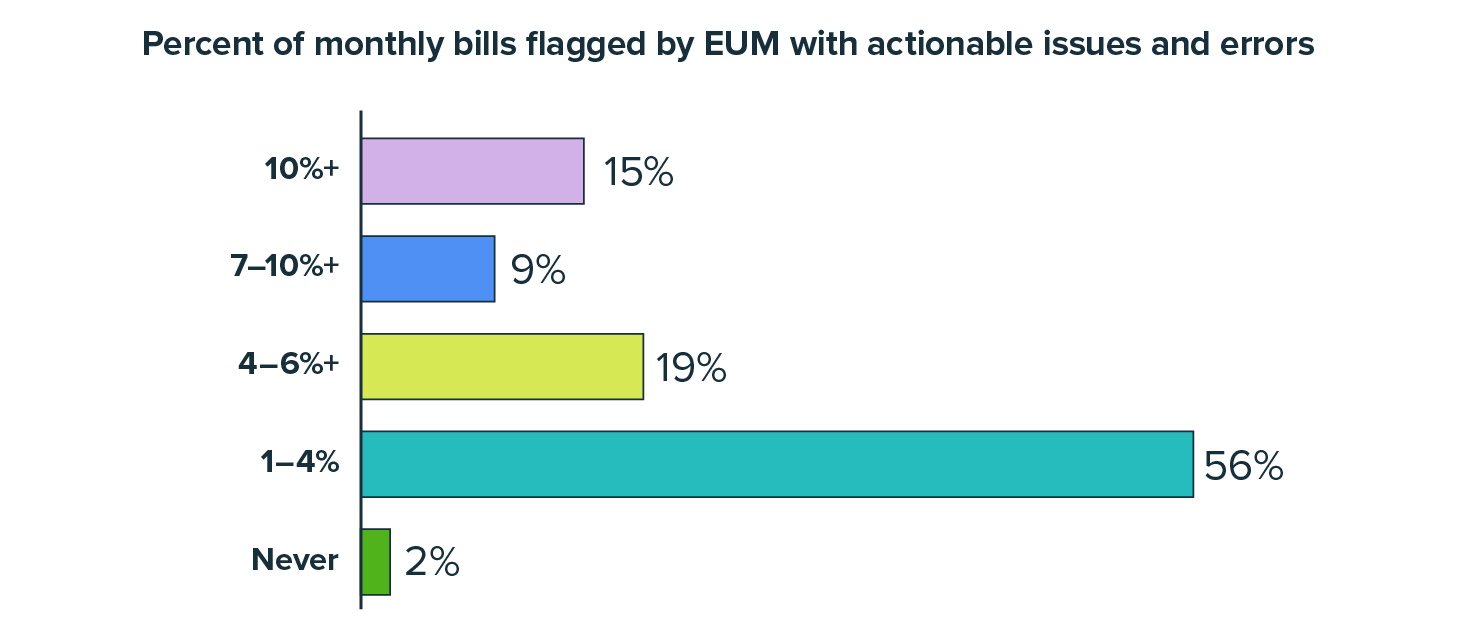
EnergyCAP Utility Management automatically audits every utility bill entered into the platform. Bill flags point you directly to any areas of concern, helping you identify and resolve issues quickly–usually before the bill is even paid. Discovering things like billing errors, unusual use patterns, or unexpected costs puts money back in your pocket and towards your bottom line. Adding notes and assigning actions to others keeps everything in your single source of truth.
The bottom line
Every bill issue flagged by EnergyCAP Utility Management is an opportunity to cut costs, solve issues in your buildings, and save time.
We asked customers which features in EnergyCAP Utility Management saved the most time and cost for their organization. Effectively every area of the platform was praised in their responses, but we’re whittling it down to the top 6 to share in this report.
Every single feature in EUM is designed to save cost, save time, reduce energy usage, eliminate errors, or build insights. No two organizations, or industries, are going to find those savings through exactly the same methods (except you Government, Higher Education, and K-12–we see your collective obsession with Reports and Dashboards), but the good news is you don’t have to choose. EnergyCAP Utility Management democratizes access to energy information across teams, facilitating in-depth analysis and easily delivering actionable insights without manual work.
The vast majority of respondents saved time on tasks that used to be done manually once they began using EnergyCAP Utility Management.
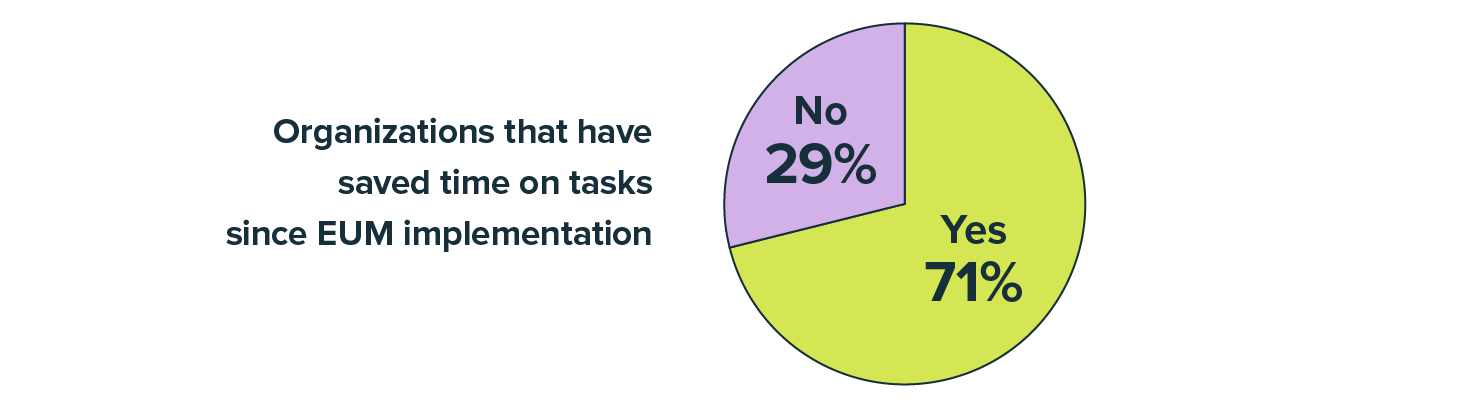
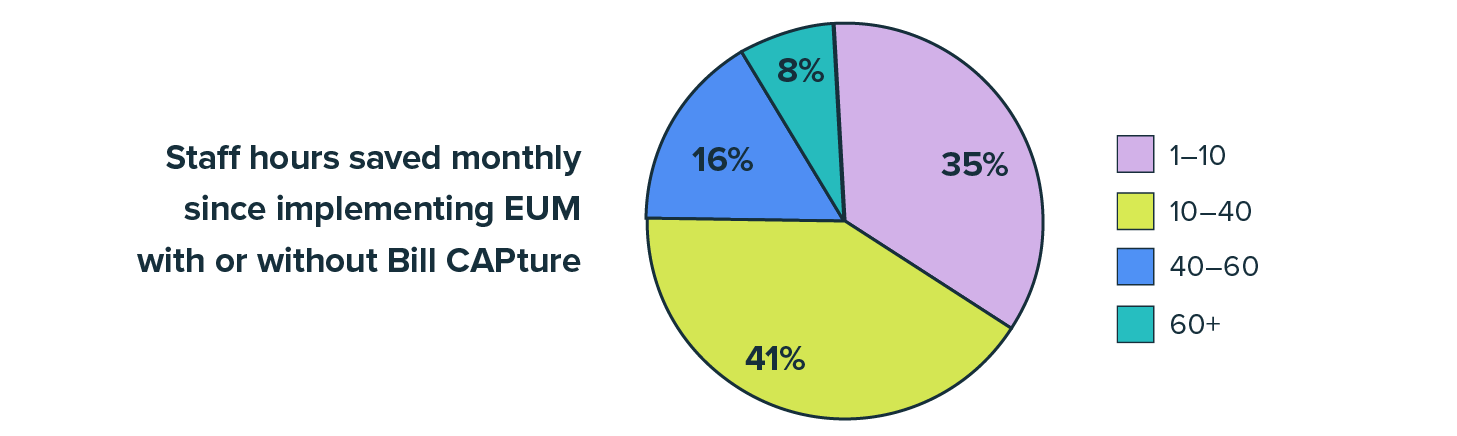
Let’s dig a little deeper and quantify that savings.
What we think
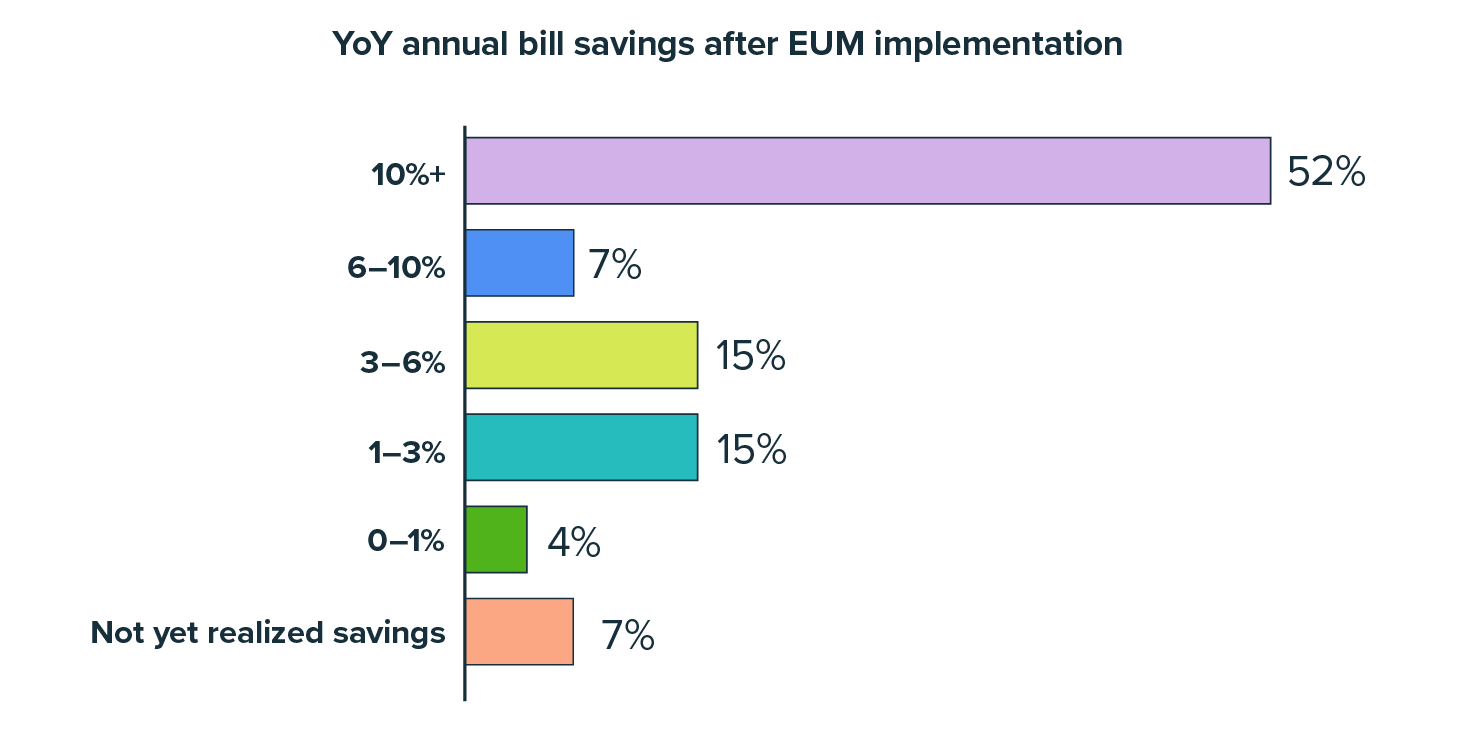
It’s no wonder organizations who use EnergyCAP Utility Management collectively saw bill savings of more than $8 BillionB in 2023. The benefits of lower utility bills costs and fewer employee tasks are self-evident—they free up valuable resources for other areas of your business. Imagine what your employees can accomplish with more than 11 weeks of newly available time, or where you might invest the 10% you save on utility bills, after you’ve implemented EnergyCAP Utility Management and handed off manual data entry to us with Bill CAPture services.
The bottom line
EnergyCAP Utility Management measurably saves significant amounts of money—through employee time spent elsewhere, in lower utility bills costs, and as building and billing issues are corrected.
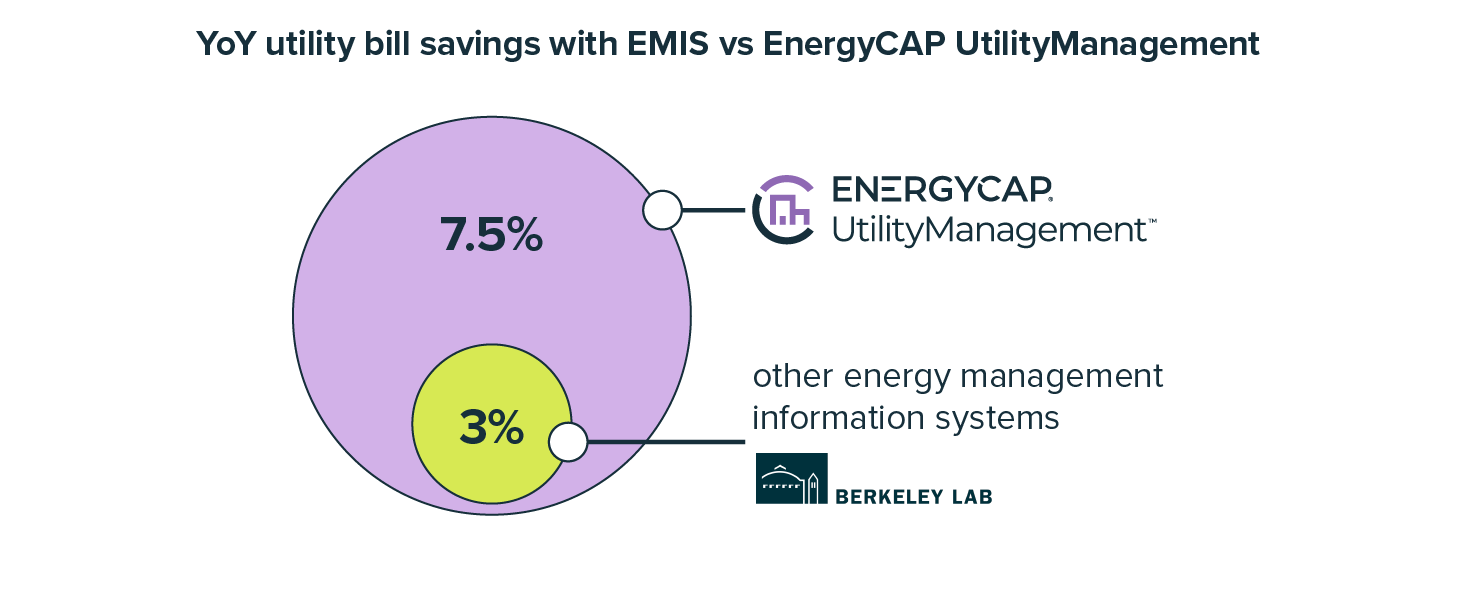
The Berkeley National Lab found that implementing an energy management information system leads to annual energy cost savings of around 3%. This figure has become an industry standard that many providers hang their hat on. EnergyCAP is thrilled that the average savings reported by our customers far outstrips this number.
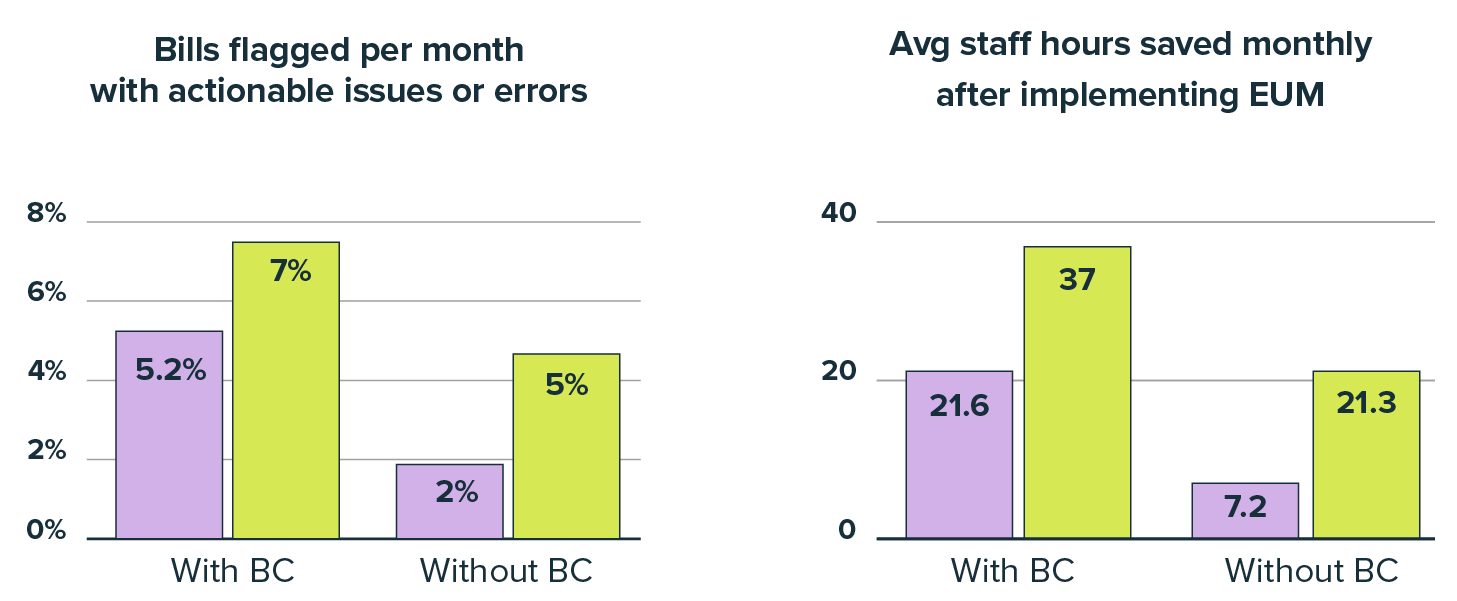
About half of survey respondents were also Bill CAPture subscribers. Unsurprisingly, passing off manual utility bill data entry to the experts at EnergyCAP saves these organizations significant amounts of time and cost, but even we’re surprised at just how big the impact is.
What we think
Accurate utility bill accounting and effective energy management starts with capturing complete utility bill data. Implementing EUM as your energy and utility management platform establishes a single source of truth for this data, resulting in enormous time and cost savings. Eliminating manual utility bill data entry amplifies all of those efforts–freeing up even more time and resources, and propelling you closer to lower GHG emissions without your focus having to be on your keyboard.
The bottom line
Every month, Bill CAPture services save up to 5X the amount* of employee time, and result in as much as 4X the number of bills* flagged with actionable issues, over implementing EnergyCAP Utility Management alone.
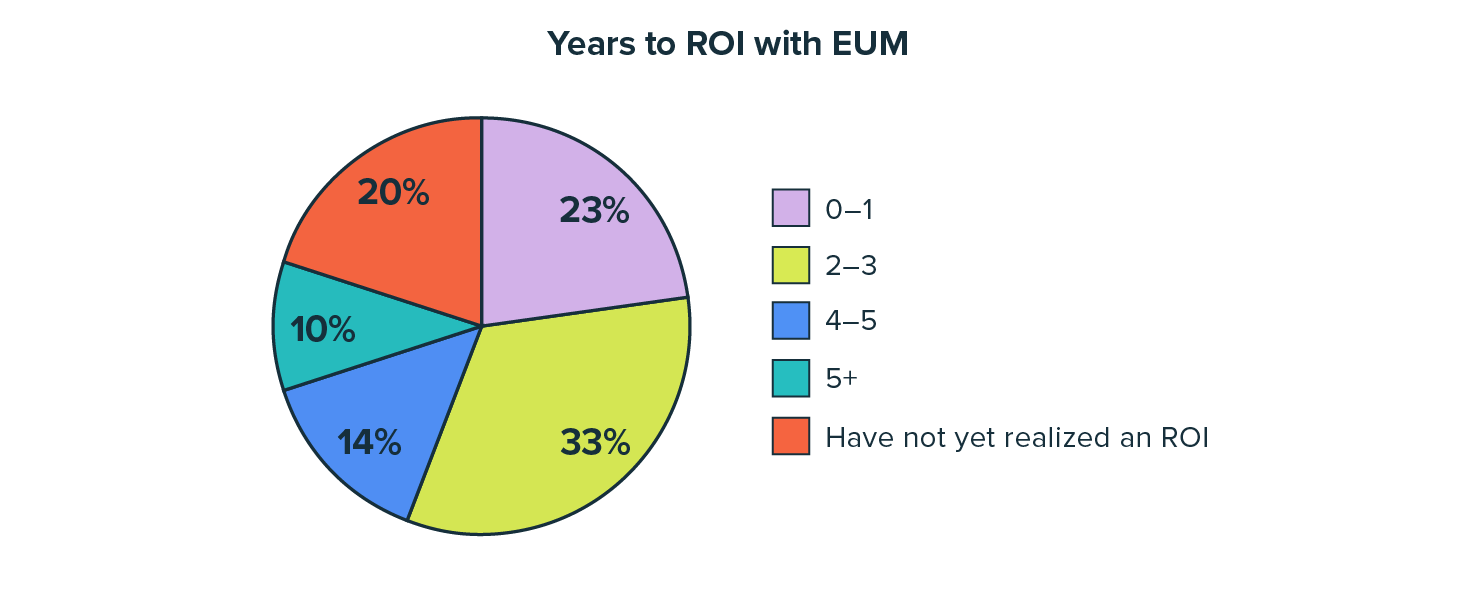
Drumroll, please. The key question for many organizations weighing whether they should continue to wrangle utility and sustainability data internally through spreadsheets and shared documents, or implement a software like EnergyCAP, is “when will I see a return on my investment?”. When you choose EnergyCAP UtilityManagement, the answer is: much sooner than you might think.
What we think
Apart from being a single source of truth for your entire organization, a path to data-driven energy decisions, and a holistic energy data reporting tool, EnergyCAP solutions are a sound financial investment. For most customers, the savings generated through EnergyCAP Utility Management will outweigh the implementation and licensing costs within a few short years.
For this section, we left the questions open ended and optional. While we couldn’t include all responses, we’ve listed the most helpful and frequent responses to each question.
Benchmarking
“Benchmarking with ENERGY STAR Portfolio Manager. We have saved the time it would take to upload information into both platforms”
“We are able to complete our Benchmarking efficiently”
“Our goal is to achieve ENERGY STAR certification for as many buildings as possible. We’ve recently certified 3 new buildings directly through EUM.”
Facilities
Notes key
* – The average, or mean, of all survey responses
A – Salary time savings based on the average annual salary of an energy manager, finance manager, and facilities director in the United States as reported by Indeed.com plus average payroll costs
B – Cost avoidance total for all EUM licensed databases from Jan 1–Dec 31, 2023.