Headquarters
EnergyCAP, LLC
360 Discovery Drive
Boalsburg, PA 16827
Denver, CO
Suite 500
5445 DTC Parkway
Greenwood Village, CO 80111
Dublin, Ireland
Unit F, The Digital Court, Rainsford Street,
Dublin 8, D08 R2YP, Ireland
Phone: 877.327.3702
Fax: 719.623.0577
Energy management software collects and organizes utility bills, interval meter data, and building information to help you track energy use, costs, and emissions in one place. Many teams feel the pain of scattered invoices, messy spreadsheets, surprise utility charges, and slow reporting. Use this energy management software comparison to evaluate energy management platforms and renewable energy management software side-by-side.
Energy management software, and broader energy management and monitoring software, turn scattered utility bills, interval data, and site details into reliable information your team can use.
The right platform reduces late fees and data entry, improves budget accuracy, and gives finance, facilities, and sustainability a single source of truth to spot waste and verify savings. Benefits include:
When these benefits stack up, teams spend less time chasing data and more time fixing what matters: cutting costs, improving reliability, and meeting sustainability goals. To dive more into ESG, see our sustainability reporting platform overview.
Selecting a platform is about more than dashboards; the best energy software solutions combine accurate data, dependable operations, and clear reporting that your teams can trust. The features below form a practical checklist to evaluate fit, scalability, and long-term value.
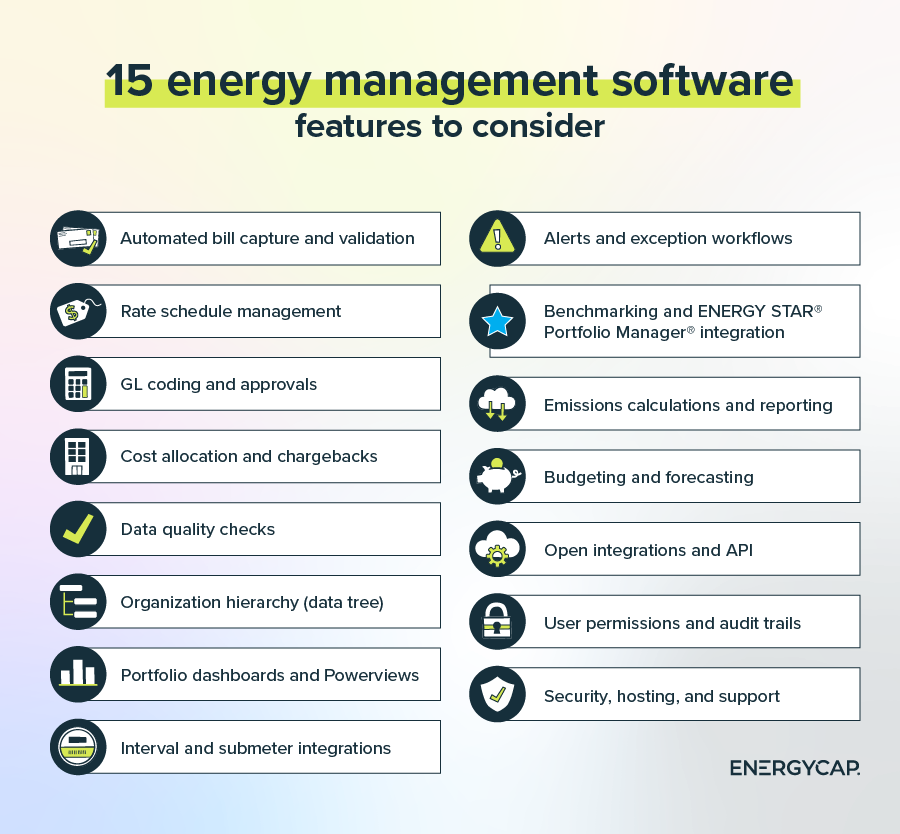
For a deeper exploration of tools and features, dive into our roundup of the best energy management tools to help cut utility costs.
Don’t struggle with data quality or limited visibility. Our guide compares leading energy management products from established energy management systems companies to help you shortlist the right fit. We break down 21 leading options with who they are best for, key features, pros, and cons.
Plus, we answer some of the most common questions you might have when selecting the best energy management platforms for your organization. We highlight leaders from established top energy management companies to help you shortlist faster.
| Energy management software | Best for | Key features |
|---|---|---|
| EnergyCAP Utility Management | Teams buried in messy utility bills, late fees, and spreadsheets who need audit-ready, finance-grade control in one system |
|
| IBM Envizi | Enterprises focused on corporate sustainability reporting and emissions accounting across complex data sources |
|
| Schneider Electric EcoStruxure Resource Advisor | Portfolios engaging Schneider sustainability services with centralized energy and emissions program tracking |
|
| Siemens Building X Energy Manager | Owners standardizing analytics and targets across BAS-connected buildings with strong OEM ties |
|
| Honeywell Forge Energy Optimization | Large facilities prioritizing equipment optimization and fault reduction through advanced analytics and controls |
|
| Johnson Controls OpenBlue Enterprise Manager | Organizations aligning building performance, comfort metrics, and diagnostics within a Johnson Controls ecosystem |
|
| Spacewell Energy (Dexma) | Portfolios wanting quick start monitoring, alerts, and forecasting with broad hardware compatibility |
|
| GridPoint | Multi-site retail and restaurant chains standardizing schedules, controls, and site-level savings |
|
| CopperTree Analytics Kaizen | Teams running continuous commissioning programs that need prioritized diagnostics and root-cause insights |
|
| Facilio | Owners combining energy analytics with asset and work management in an integrated operations platform |
|
| Enertiv | Commercial real estate teams prioritizing equipment-level visibility and runtime analytics over billing workflows |
|
| Gridium | Facilities focusing on tariff strategy, interval insights, and demand management without heavy AP processes |
|
| EnergyPrint | Organizations outsourcing utility data services for simple dashboards, not full GL coding or chargebacks |
|
| Powerhouse Dynamics SiteSage | Small to mid-size multi-site portfolios needing standardized equipment controls and scheduling |
|
| Planon Energy Management | Real estate groups integrating energy and emissions with space, lease, and facilities processes |
|
| ENERGY STAR® Portfolio Manager® | Industry-standard benchmarking and recognition across properties, not end-to-end billing management |
|
| Arius Building Insights (formerly Lucid BuildingOS) | Portfolio transparency and stakeholder communications via dashboards and alerts with light workflows |
|
| Clockwork Analytics | Operators who need automated diagnostics with quantified impact to drive maintenance actions |
|
| SkyFoundry SkySpark | Teams with analytics expertise that want a rules-based engine for custom anomaly detection |
|
| Yardi Pulse Energy | Real estate portfolios aligning energy visibility inside existing Yardi property operations |
|
| Deepki Ready | Multi-country owners standardizing sustainability metrics and disclosures across regions and utilities |
|

Best for: Teams buried in messy utility bills, late fees, and spreadsheets who need audit-ready, finance-grade control in one system
Key features:
Pros:
Cons:
EnergyCAP Utility Management centralizes utility bills, meters, submeters, and rate schedules so you don’t have to chase data across emails and spreadsheets. Automated bill capture and validation reduce late fees and missing invoices, while GL coding and account mapping cut rework for finance. All working together to reduce energy costs.
Portfolio rollups and Powerviews replace manual reports that take days, and built-in quality checks catch duplicates, outliers, and estimated reads before they skew budgets or trigger surprise charges. With audit trails, chargeback support, and budgeting tools, EnergyCAP helps finance, facilities, and sustainability teams work from a single source of truth
See how standardized validation, chargebacks, and budgeting help organizations achieve cost avoidance.
Pro Tip: Within the category of renewable energy management software, EnergyCAP supports emissions reporting and benchmarking for portfolios pursuing clean energy goals through EnergyCAP Carbon Hub.

Best for: Enterprises focused on corporate sustainability reporting and emissions accounting across complex data sources
Key features:
Pros:
Cons:
Envizi consolidates utility, meter, and operational data into a governed model, so finance, facilities, and sustainability reference the same numbers. Enterprises can use it to calculate emissions with clear source tracing, manage portfolios at scale, and configure dashboards and permissions for audits and internal reviews. Value is highest when data ownership, naming standards, and QA routines are established early, since configuration and stewardship drive consistent reporting.

Best for: Portfolios engaging Schneider sustainability services with centralized energy and emissions program tracking
Key features:
Pros:
Cons:
Resource Advisor functions as a central hub for Schneider‑supported programs, combining utility bills, interval reads, and supplier data with targets, disclosures, and project workflows. Teams connect consumption and cost to progress against goals while routing issues to the right owners. The platform works well when roles, processes, and training are defined, especially in conjunction with Schneider data services or advisory engagements.
Best for: Owners standardizing analytics and targets across BAS-connected buildings with strong OEM ties
Key features:
Pros:
Cons:
Building X Energy Manager unifies BAS and meter data in a shared analytics layer to standardize targets, flag anomalies, and coordinate projects across sites. Alerts surface drift and operational issues quickly, and portfolio views support comparisons and prioritization. Results depend on reliable data and a structured rollout plan with conventions for points, thresholds, and site naming.

Best for: Large facilities prioritizing equipment optimization and fault reduction through advanced analytics and controls
Key features:
Pros:
Cons:
Forge analyzes equipment and sensor trends to identify faults and recommend control adjustments that reduce waste and comfort complaints. Large facilities can use it to prioritize fixes, tune systems, and sustain performance without constant manual retuning. Trustworthy sensors, clear procedures, and change management are essential to convert recommendations into measurable gains.
Best for: Organizations aligning building performance, comfort metrics, and diagnostics within a Johnson Controls ecosystem
Key features:
Pros:
Cons:
OpenBlue brings building, asset, and meter information together, so operators can track consumption, emissions, and comfort in one place. Diagnostics and KPIs link symptoms to likely causes, shortening the time from alert to resolution. Strong naming standards and governance improve clarity at scale, and deeper integrations may extend timelines.

Best for: Portfolios wanting quick start monitoring, alerts, and forecasting with broad hardware compatibility
Key features:
Pros:
Cons:
Spacewell emphasizes quick, hardware‑agnostic data capture to deliver interval and meter insights fast. Forecasts, benchmarking, and alerts help identify underperformers and anomalies without heavy setup. Baselines and a clear organization hierarchy improve alert quality and keep reports consistent for complex portfolios.


Best for: Multi-site retail and restaurant chains standardizing schedules, controls, and site-level savings
Key features:
Pros:
Cons:
GridPoint combines metering, monitoring, and remote controls to standardize scheduling and reduce wasted runtime across many small sites. Retail and restaurant chains may use it to curb after‑hours use, minimize drift, and prioritize fixes across formats. Disciplined installation, commissioning, and staff training are key to sustained results.

Best for: Teams running continuous commissioning programs that need prioritized diagnostics and root-cause insights
Key features:
Pros:
Cons:
Kaizen supports continuous commissioning with fault detection, diagnostics, and impact scoring so teams know where to act first. Prioritized issue lists and root‑cause insights translate data into focused maintenance plans and measurable savings. Accurate point mapping and recurring reviews keep priorities current and outcomes reliable.

Best for: Owners combining energy analytics with asset and work management in an integrated operations platform
Key features:
Pros:
Cons:
Facilio blends portfolio energy analytics with asset and work management to reduce handoffs between teams. Metering integrations, dashboards, and FDD connect directly to work orders, so operators can act on insights quickly. Aligning data models and roles before rollout improves adoption and keeps the platform organized.
Best for: Commercial real estate teams prioritizing equipment-level visibility and runtime analytics over billing workflows
Key features:
Pros:
Cons:
Enertiv delivers equipment‑level visibility through meters and sensors, converting runtime and performance data into cost and risk insights. Owners can use it to spot hidden consumption, prevent failures, and verify the impact of fixes. Success depends on a verified equipment inventory, thoughtful sensor deployment, and consistent naming.

Best for: Facilities focusing on tariff strategy, interval insights, and demand management without heavy AP processes
Key features:
Pros:
Cons:
Gridium focuses on bill analytics, tariffs, and interval trends to reveal cost drivers and manage demand. Facility management relies on clear visuals and alerts to catch anomalies sooner and compare performance to baselines. Clean tariff and meter data are crucial, and many portfolios pair Gridium with other tools for controls or AP processes.

Best for: Organizations outsourcing utility data services for simple dashboards, not full GL coding or chargebacks
Key features:
Pros:
Cons:
EnergyPrint provides utility data services and dashboards that reduce manual bill gathering and fill gaps in history. Organizations gain straightforward portfolio views and QA without building an internal pipeline. As needs expand to GL coding, cost allocation, and chargebacks at scale, buyers often consider a dedicated utility management platform.

Best for: Small to mid-size multi-site portfolios needing standardized equipment controls and scheduling
Key features:
• Equipment-level monitoring and control
• Scheduling, setpoint management, and alerts
• Portfolio reporting for multi-site operations
Pros:
• Equipment-level monitoring and control
• Scheduling and alerting to cut wasted run time
• Portfolio reporting for multi-site operations
Cons:
• Installation quality strongly affects outcomes
• Ongoing user training supports consistency
SiteSage targets small- to mid-size multi‑site portfolios that need consistent equipment control and monitoring. Scheduling, setpoints, and alerts reduce wasted runtime and address drift across locations with simple dashboards. Outcomes depend on installation quality, ongoing user training, and periodic configuration reviews.


Best for: Real estate groups integrating energy and emissions with space, lease, and facilities processes
Key features:
Pros:
Cons:
Planon links energy, cost, and emissions to real estate data so portfolio decisions consider space, leases, and assets alongside consumption. Benchmarks and metering integrations provide a shared view for planning and reporting. Because the platform spans multiple functions, governance, and phased deployment, teams can adopt features without stretching timelines.

Best for: Industry-standard benchmarking and recognition across properties, not end-to-end billing management
Key features:
Pros:
Cons:
Portfolio Manager offers industry‑standard benchmarking, ENERGY STAR scores, and EUI metrics across properties. It centralizes attributes and utility data to identify underperformers and track recognition over time. The tool is not a complete utility bill management system, so QA checks are essential to maintain reliable comparisons.
Best for: Portfolio transparency and stakeholder communications via dashboards and alerts with light workflows
Key features:
Pros:
Cons:
Atrius aggregates utility and building data into dashboards, benchmarks, and alerts to enhance portfolio transparency and support stakeholder updates. Teams get quick visibility into trends and exceptions with light initiative tracking. Reporting clarity improves when hierarchies and authoritative data sources are defined before expansion.

Best for: Operators who need automated diagnostics with quantified impact to drive maintenance actions
Key features:
Pros:
Cons:
Clockworks automates diagnostics and quantifies impact, so operators can triage maintenance based on savings potential and risk. Root‑cause tools streamline investigations and link findings to action through maintenance systems. Detailed point mapping, QA, and regular reviews keep priorities aligned with changing conditions.

Best for: Teams with analytics expertise that want a rules-based engine for custom anomaly detection
Key features:
Pros:
Cons:
SkySpark is a rules‑based analytics engine for teams that prefer bespoke anomaly detection and tagging. It supports connectors for BAS, meters, and IoT with trend visualization to validate findings and refine logic. Developing and governing rule libraries requires expertise and lifecycle management to prevent model sprawl.
Best for: Real estate portfolios aligning energy visibility inside existing Yardi property operations
Key features:
Pros:
Cons:
Pulse Energy brings metering and interval visibility into familiar Yardi property operations with dashboards and alerts for asset teams. Owners may use it to reduce after‑hours consumption and standardize checks across properties. Fit improves when workflows align with Yardi processes and data normalization across utilities.

Best for: Multi-country owners standardizing sustainability metrics and disclosures across regions and utilities
Key features:
Pros:
Cons:
Deepki centralizes multi‑country utility datasets to standardize sustainability metrics, benchmarking, and target tracking across regions. Owners use portfolio reports and QA tools to compare assets fairly and prepare disclosures with fewer manual steps. Strong governance across varied sources keeps results consistent, and deeper operational analytics may require complementary monitoring or control tools.
Good tools still fail without the right setup. Prevent common problems by standardizing data, defining ownership, and phasing your rollout. Treat integrations, permissions, and reporting as part of implementation, not afterthoughts. Here are a few challenges and how you can tackle them.
Problem: Imports fail, bills do not match, and dashboards mislead because hierarchies, meters, and rates are inconsistent.
Solution: Define your organization hierarchy, naming standards, meter mappings, and rate schedules before loading history. Stand up a recurring QA routine to catch duplicates, outliers, and estimated reads each cycle. For integrations, document field mappings, use API or SFTP with test files, and enable alerts so issues are found and fixed within the billing period.
Problem: Work stalls when no one owns tasks, permissions are vague, and training is ad hoc.
Solution: Publish a RACI, map roles to permissions and approvals, and set review cadences for validation, chargebacks, and reporting. Create short SOPs and task-based training so new users can self-serve, then track adoption with simple KPIs such as on-time billing, exception closure rate, and audit response time.
Problem: Projects run long, and budgets swell when teams chase custom features and add sites without measures of success.
Solution: Phase deployment. Start with core bill management and reporting, define success metrics, then add interval data, projects, and new sites after targets are met. Favor configuration over customization, confirm total cost of ownership for support, storage, and integrations, and ensure export options and data ownership are clear in the contract.
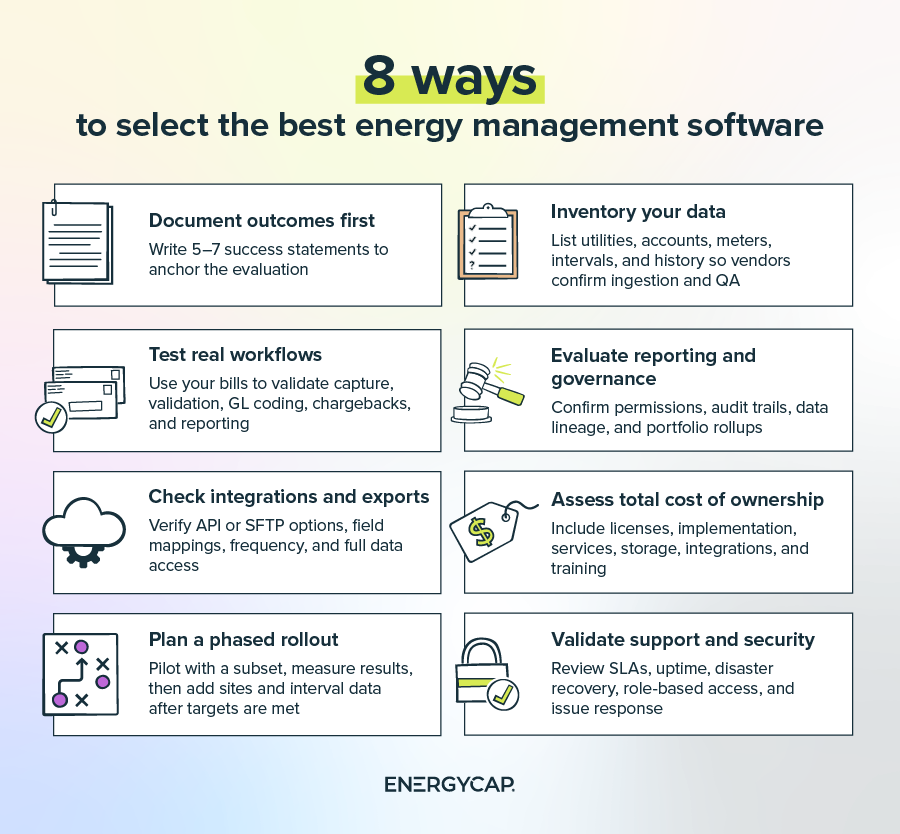
Choosing a platform works best when you translate goals into clear requirements. Define what success looks like for finance, facilities, and sustainability, then score vendors across energy software solutions. Here are a few considerations to get you pointed in the right direction:
Energy management software should turn bills and meter data into confident decisions. With the right platform, you get cleaner data, fewer late fees, faster closeouts, and clear portfolio reporting for finance, facilities, and sustainability. Tools like EnergyCAP Bill Pay can even help automate utility bill payments.
See how a specialized utility management platform handles bill capture, GL coding, chargebacks, benchmarking, and audit-ready reporting in one system. Request an EnergyCAP Utility Management demo, and discover how the solution turns cost avoidance into savings.
Most energy management systems companies provide APIs or file-based options so information flows without reentry. Common integrations include AP, ERP, and GL systems; single sign-on; data warehouses and BI tools; ENERGY STAR® Portfolio Manager®; building automation systems; submeters and IoT gateways; utility EDI or SFTP feeds; and CMMS or work order tools.
EnergyCAP Utility Management supports these patterns with API and file-based options, as well as a direct connection to ENERGY STAR® Portfolio Manager® for benchmarking.
Energy managers use a stack: energy management software, energy management and monitoring software, building automation, FDD analytics, CMMS or EAM, and BI. Many teams anchor billing, GL coding, chargebacks, and portfolio reporting in EnergyCAP, then pair it with BAS, submeters, and interval tools.
Most efforts fall into three groups: utility bill management to clean data and standardize reporting; monitoring and targeting to use interval data and benchmarks; and continuous commissioning to apply analytics and resolve equipment issues. EnergyCAP Utility Management supports the first group with audit-ready bills, variance tracking, and benchmarking, and it can feed data to tools used in the other two.
Pricing depends on portfolio size, number of utilities and meters, selected modules, data services like bill collection and validation, implementation scope, integrations, hosting, and support.
A smart analytics system combines meters and sensors with cloud analytics, alerts, and, sometimes, controls to monitor use, detect anomalies, and optimize operations. It normalizes utility and building data, flags exceptions, supports reporting and benchmarking, and can trigger work orders.
EnergyCAP Smart Analytics adds interval data analysis, anomaly detection, and performance tracking to EnergyCAP Utility Management, helping pinpoint savings opportunities and verify results.