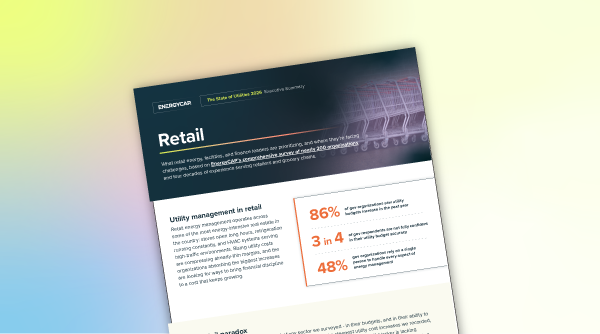


For most organizations, energy and utility costs sit quietly in the background; processed, paid, and filed away as a routine operating expense. But that mindset is becoming increasingly risky....


Headquarters
EnergyCAP, LLC
360 Discovery Drive
Boalsburg, PA 16827
Denver, CO
Suite 500
5445 DTC Parkway
Greenwood Village, CO 80111
Dublin, Ireland
Unit F, The Digital Court, Rainsford Street,
Dublin 8, D08 R2YP, Ireland
Phone: 877.327.3702
Fax: 719.623.0577
Rising rates make budgeting tough, especially across multiple sites. Our utility bill increase calculator estimates your 2026 electric, natural gas, and water costs by state, based on average rate changes and your 2025 spend. Think of it as your electricity bill calculator, natural gas bill calculator, and utility cost calculator in one; a quick utility cost estimator to compare locations side by side and forecast your utility budget with confidence.
Wondering “how much is the electric bill” next year? Water and sewer charges are climbing quickly, and many utilities won sizable rate cases in 2025, setting us up for significantly higher electric bills in 2026. Increasing electric bills are likely to continue.
See projected totals, take the short questionnaire to uncover unique utility bill savings opportunities for your organization, and export an easy-to-share report for your leadership team.
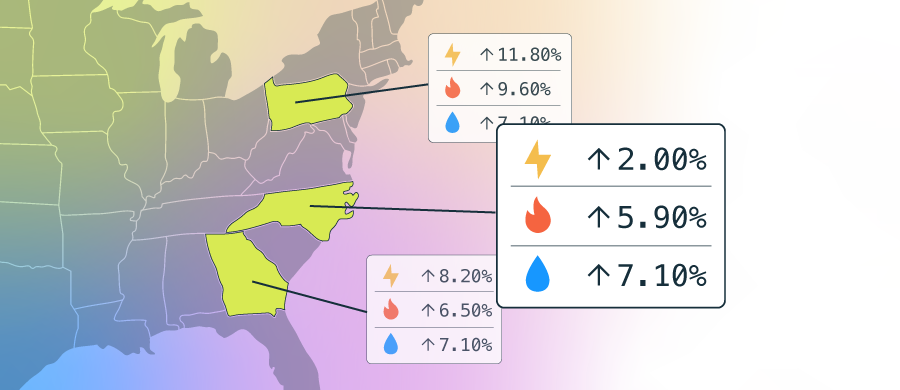
Select one or more states on the interactive U.S. map to see projected 2026 increases for electric, natural gas, and water. Our utility bill increase calculator applies state-level average rate changes, so you can compare locations side by side and spot where costs are likely to rise fastest.
After selecting your states, enter your 2025 spend by utility in the table. The calculator estimates your 2026 totals and year-over-year change, providing a quick, consistent way to budget for single sites or multi-state portfolios.
Pro tip: Avoid costly late fees by using an automated utility payment solution that handles everything from invoice entry and auditing for costly errors to secure, on-time payments.
If you prefer spreadsheets or a simple bill calculator workflow, here’s how to calculate each figure on your own. Grab each state’s average increase rates from the table above, and your 2025 spend by utility. Use the formulas below to project 2026 totals, year-over-year changes, and simple monthly estimates.
Single state, single utility
Multi-state or multi-site portfolio
Weighted average 2026 increase
If you budget by unit price
Remember: Averages do not reflect your specific rate schedule, fees, or taxes. Use them as a starting point, then validate the data with your utility invoices and GL data.
Electricity demand is climbing after years of flat growth, driven by rapid data center expansion, so many regions expect higher consumption and capacity needs through 2026.
Water rates are rising as systems fund major capital projects and comply with new federal PFAS standards that require costly treatment upgrades.
Here are practical steps you can take now:
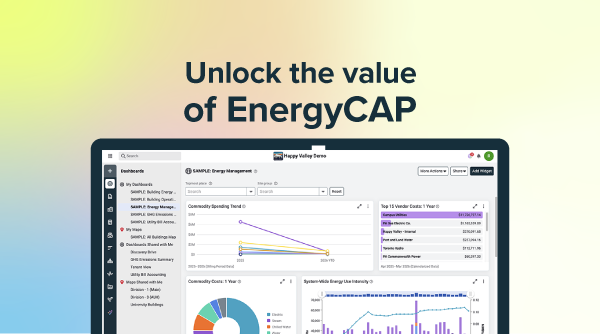
You’ve seen how projected increases affect your 2026 budgets, but they’re only half the story. Confidence comes from the data behind your budget. EnergyCAP brings your bill, meter, and interval data together in one place, giving Finance, Energy, and Facilities the tools they need.
Our rate estimator is a great starting point, and EnergyCAP takes it further with true utility budgeting and forecasting built on normalized usage, complete cost detail, and bespoke AI tuned for utility complexity.
Ready to turn estimates into energy savings in 2026? Get a walkthrough of your portfolio with our team by requesting an EnergyCAP demo.
Beyond usage, peaks, and billing errors, spikes are also tied to external factors: state PUC-approved rate cases that raise base charges, riders, and fees; shifts in fuel costs (which ripple into electric supply rates); and sector trends, like fast-growing data center load, that push system investments and capacity needs.
Water bills are also being affected by new federal PFAS standards that require costly monitoring and treatment. Stay up to date with utility trends from top energy management companies.
If you’re budgeting with a flat “3% increase,” you’re already behind. We’re in an unprecedented stretch of rising utility costs driven by climate events, including wildfires and droughts, surging electricity demand from data centers, and aging infrastructure that’s expensive to maintain and upgrade.
The impact varies dramatically by region. To get a better estimate, use our regional projections with data through 2030—then validate the numbers against your own bills using the calculator above.
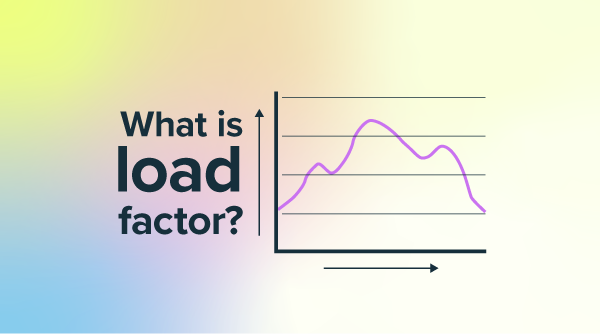
For commercial accounts, the biggest drivers within your control are total kilowatt-hour consumption and demand charges tied to your highest 15-minute interval peak. Time-of-use pricing also makes on-peak hours more expensive. HVAC runtime, simultaneous equipment starts, electric resistance heat, and unoptimized building schedules often create the largest, most fixable costs.