


"It is incredible to me what shared challenges and situations higher ed has and EnergyCAP really really gets that, which I appreciate."


Headquarters
EnergyCAP, LLC
360 Discovery Drive
Boalsburg, PA 16827
Denver, CO
Suite 500
5445 DTC Parkway
Greenwood Village, CO 80111
Dublin, Ireland
Unit F, The Digital Court, Rainsford Street,
Dublin 8, D08 R2YP, Ireland
Phone: 877.327.3702
Fax: 719.623.0577
Report Designer BI makes it easy for EnergyCAP UtilityManagement™ users to gain actionable insights from their energy data using the power and flexibility of their favorite business intelligence applications—Power BI®, Tableau®, Excel, and others.
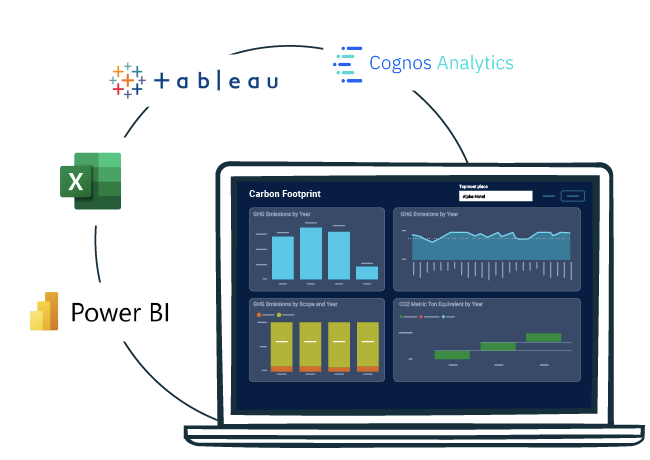
The Report Designer BI module—a Power BI-based application—connects to a copy of your EnergyCAP database with a provided username and password. Configuration is easy and takes only a few simple clicks from within the platform of your choice: Power BI, Tableau, Excel, and others. After you are connected, you can begin your data analysis right away with data visualization and report templates. Step-by-step help documentation is provided to get new users started, and a sample file is available to demonstrate the value and breadth of the Report Designer BI service.
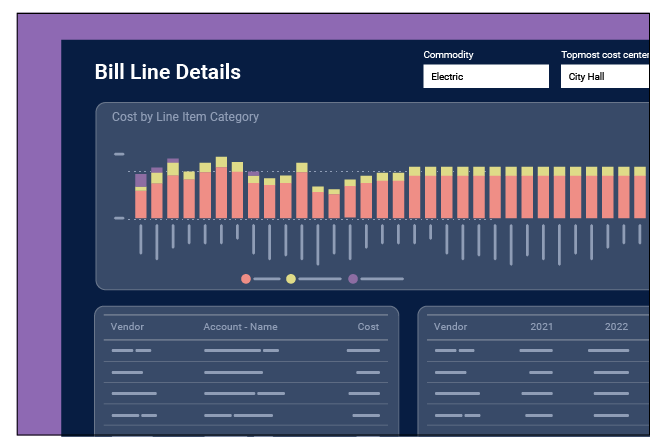
When you connect your single source of energy and sustainability data truth with your organization’s preferred business intelligence tools, creating customized reports and advanced visualizations could not be simpler. Enjoy the flexibility of your favorite BI tools connected seamlessly to your utility data.
Our energy and sustainability ERP brings cross-functional teams together, in a single platform, to drive cost-effective and responsible utilization of finite resources.


Watch a demonstration or contact us to learn how you can gain access and start deriving even more value from your complex utility bill data.