Achieving an Energy Reduction Mandate–Part Three: Verify & Share Your Success
This is the third and final blog on the subject of achieving an energy or emissions reduction mandate. It’s increasingly common for organizations to enact energy and environmental initiatives, yet there’s no clear-cut guide that energy, facility, and sustainability managers can follow to ensure success. This blog series aims to be that guide.
We explained in Blog #1 that the energy management process begins with centralizing your utility bill and energy consumption data. Establishing a comprehensive energy database enables you to establish your baseline (i.e., starting point) and sets you up for future mandate-meeting success. In Blog #2, we outlined multiple tools and methods for analyzing your data to identify energy- and emissions-reduction opportunities. This third post explains how you can objectively verify your energy savings and communicate your progress.
An Apples-to-Apples Comparison
The energy consumption baseline you’ve now developed is the measuring stick against which progress toward your energy reduction goal or mandate will be evaluated. The challenge is to make sure that you’re evaluating your performance in a fair, apples-to-apples manner.
Weather Normalization
The purpose of weather normalization is to eliminate weather as a factor in energy consumption to present a fair month-to-month comparison. The process begins with calendarized usage data, wherein energy use is divided into daily “buckets” (i.e., calendarized) and allocated to the appropriate calendar month. When a meter is not weather sensitive, the bill is simply prorated into each month based on the number of billing period days; total usage is divided by the number of days in the month.
When a meter is weather sensitive—determined by statistical analysis—a more sophisticated method is used to prorate the weather-sensitive portion of the energy consumption based on the number of degree days in the appropriate billing period in each month, and to prorate the remaining, not weather-sensitive portion based on the number of days. The images below show examples of weather-sensitive and non-weather-sensitive meters:
The positive line slope in the left-hand image illustrates that more energy is consumed as cooling degree days increase (reflective of increasing daily mean temperature), confirming that consumption measured by that utility meter is impacted by the weather. Therefore, in a year where temperatures are above average, the facility is likely to consume more energy, even though steps may have been taken to increase energy efficiency. Comparing monthly or annual energy use after weather has been removed more accurately reflects the impact of energy conservation efforts…
…but to get an even more accurate evaluation, additional factors should be accounted for, and that’s where the concept of Measurement & Verification comes in.
Measurement & Verification (M&V)
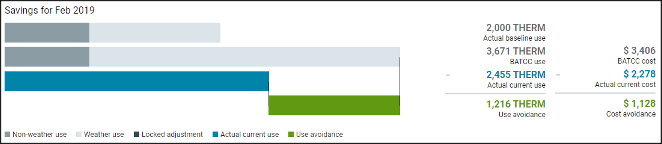
{{cta(‘ea55b9a9-3a8f-44b1-ad13-87bb2fe7d6cf’,’justifyright’)}}The measurement and verification (M&V) process compares current energy consumption with consumption in an adjusted baseline year to calculate the amount of energy you avoided using due to conservation efforts. Certified M&V processes automatically account for major variables, such as weather (degree days), billing period length, floor area changes, and commodity price, in addition to allowing for special adjustments related to changes in occupancy, schedule, and equipment retrofits.
While comprehensive M&V calculations are relatively detailed and complex, the process can be summarized in three primary steps:
Step #1—Establish a baseline year. Typically, this period is the twelve months immediately prior to the implementation of the energy management initiative. The baseline year is typically announced in energy reduction mandates. For example, the Commonwealth of PA’s mandate established 2017 as the baseline year.
Step #2—Adjust the baseline to today’s conditions. When all known variables—weather, billing period length, square footage changes, etc.—have been accounted for, you will have an energy cost value for the Baseline Year Adjusted To Current Conditions, which is referred to as the BATCC in EnergyCAP.
Step #3—Compare the BATCC to the current utility bills. The BATCC value reflects the amount of energy that would have been consumed without any energy conservation measures. Compare that amount to the actual consumption shown on the current utility bill, and the difference is the amount of energy not consumed due to increased energy efficiency.
Developing an accurate M&V model on your own will be a very time-consuming process and requires a high level of expertise. It’s much more cost effective to license an off-the-shelf application, like EnergyCAP, that provides M&V functionality that meets IPMVP standards.
Inform and Motivate
Laurence J. Peter is credited with the adage, “If you don’t know where you are going, you will probably end up somewhere else.” Your organization’s energy reduction mandate established the goal or destination, and the multi-year effort will require organizational buy-in—from the top-ranking executive to the rank-in-file employee. Getting that commitment and sustaining it to the point that energy and environmental conservation are engrained in your organization’s culture require clear and consistent communication.
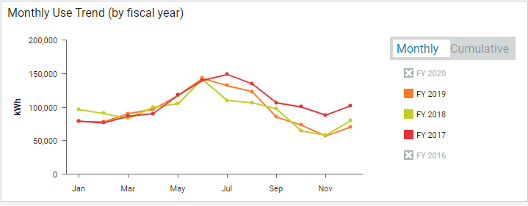
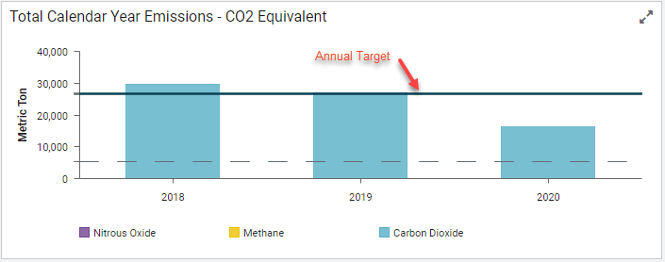
Set Yearly Targets
Start the communication process by breaking your multi-year goal into more manageable monthly or annual bites; make the long-term destination seem less daunting. The short-term goals should be communicated to your facility managers and building occupants in a format that is visible, easy to understand, and updated consistently, such as this target line PowerView™ from EnergyCAP:
Automated Reports
Having access to and sharing data is critical to the success of any energy conservation effort. In the second blog of this series, we outlined the types of reports that we feel will provide the actionable data you and your team will need to consult consistently. The one glitch we have found over our 40+ years of experience is that you can’t assume that your team will remember to generate the reports. And if they don’t produce the reports, they will either make uninformed decisions or fail to act at all, and the conservation program is destined to fail.
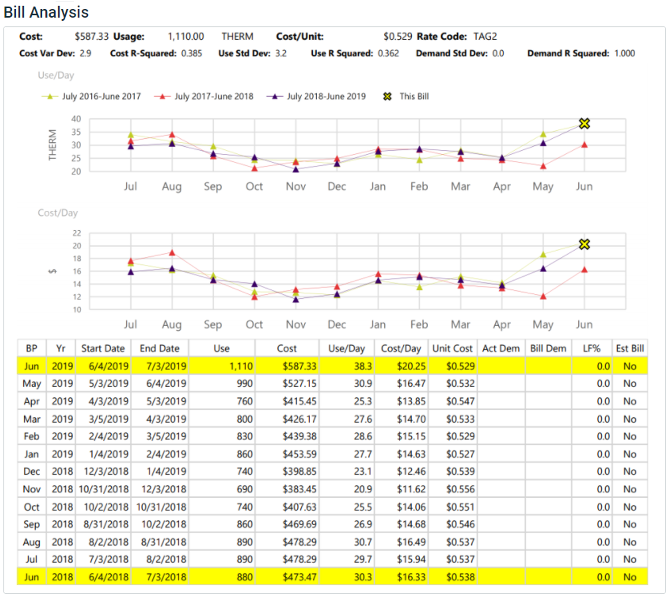
Ideally, you will overcome the reporting challenge by using an application that enables users to subscribe to reports and have them generated and emailed automatically. In EnergyCAP, for example, reports can be generated on a calendar basis (e.g., daily, weekly, monthly, or quarterly) or only when certain criteria are met. An example of the latter is the Bill Analysis report that employs quadratic regression models for energy use, cost, and demand to highlight utility bills that appear to be abnormal and should be reviewed:
You can learn more about EnergyCAP’s Bill Analysis report here. Constructing a similar type of report in Excel or other business intelligence tool may be doable, but be prepared to invest a substantial amount of effort to create and maintain it.
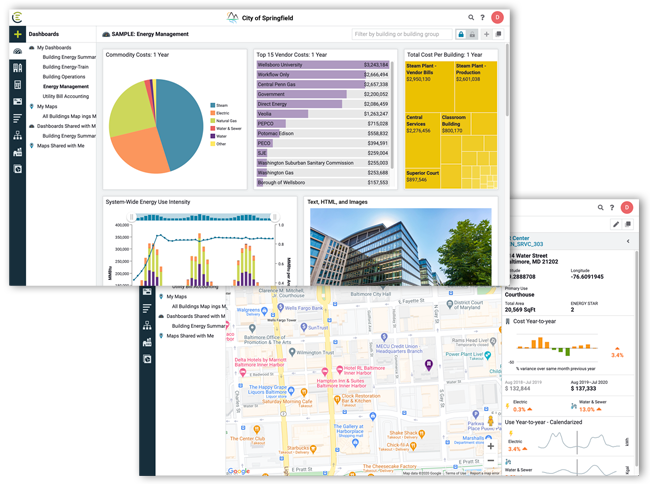
Dashboards
A decade ago, organizations attempted to encourage energy conservation by setting up energy use displays or kiosks in building lobbies. Some cited benefits, but most confirmed over time that the easy-to-ignore displays did little to encourage energy conservation or change building occupant behavior. Today, the ineffective lobby displays have been replaced with online energy dashboards, and the online displays offer multiple advantages:
Easy to access from home, office, or mobile device; can be available to the public
Can be built and customized by any authorized system user; no special design, video, or graphics skills required
Informative and easy-to-understand “real-time” content
When you’re pursuing an energy or emissions reduction mandate, the biggest advantage of online energy dashboards is they will keep you and your organization accountable. A dashboard that displays your objectives to every member of your organization and even, perhaps, to the public is a constant reminder of your mission and how far you have to go to meet complete it.
Select a tool that allows you to display the high-level and detailed data that will motivate your audience—those who work for and with your organization—to help you achieve your conservation mandate.
How EnergyCAP Can Help
We developed this three-part blog series to serve as a guide to those tasked with meeting an energy or emissions reduction mandate, recognizing that the information provided is relevant to any organization embarking on a mission to conserve energy and lower utilities costs.
As with any major undertaking, multiple paths may lead to the same outcome. However, some paths are much more challenging and require a higher level of effort. We’ve all learned that the shortest distance between two points is a straight line. At EnergyCAP, we’ve spent 40 years developing an award-winning utility bill accounting and energy management solution that is the “straight line” to long-term energy conservation success.
If you’re tasked with meeting an energy or emissions reduction mandate and want to take the path that’s proven to be easier, smarter, and friendlier, contact us to learn more about EnergyCAP. I also encourage you to read our field guide, “How to Spec and Purchase and Energy Management Information System” as you begin your research.
<?
/******************************************************
TOP BOX HEADLINE
******************************************************/
?>
This website stores cookies on your computer. These cookies are used to collect information about how you interact with our website and allow us to remember you. We use this information in order to improve and customize your browsing experience and for analytics and metrics about our visitors both on this website and other media. For more information, read our Privacy Policy.
Functional
Always active
The technical storage or access is strictly necessary for the legitimate purpose of enabling the use of a specific service explicitly requested by the subscriber or user, or for the sole purpose of carrying out the transmission of a communication over an electronic communications network.
Preferences
The technical storage or access is necessary for the legitimate purpose of storing preferences that are not requested by the subscriber or user.
Statistics
The technical storage or access that is used exclusively for statistical purposes.The technical storage or access that is used exclusively for anonymous statistical purposes. Without a subpoena, voluntary compliance on the part of your Internet Service Provider, or additional records from a third party, information stored or retrieved for this purpose alone cannot usually be used to identify you.
Marketing
The technical storage or access is required to create user profiles to send advertising, or to track the user on a website or across several websites for similar marketing purposes.

 Best-in-class portfolio-level energy and utility bill data management and reporting.
  Real-time energy and sustainability analytics for high-performance, net-zero buildings.
  A holistic view of financial-grade scope 1, 2, and 3 carbon emissions data across your entire business.
  Energy and sustainability benchmarking compliance software designed for utilities.
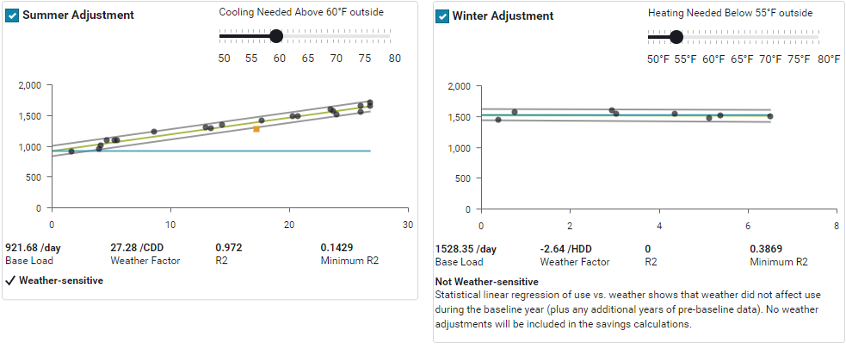
 When you’re pursuing an energy or emissions reduction mandate, the biggest advantage of online energy dashboards is they will keep you and your organization accountable. A dashboard that displays your objectives to every member of your organization and even, perhaps, to the public is a constant reminder of your mission and how far you have to go to meet complete it.