Achieving an Energy Reduction Mandate–Part Two: Identify Savings Opportunities
Public and private organizations across North America are enacting energy reduction directives, resolving to reduce energy consumption and GHG emissions by a goal percentage within a defined time period.
In Part One of this blog series, we covered the importance of establishing a baseline, as well as the challenges that come with centralizing and verifying a large organization’s substantial and diverse energy data.
Here, in Part Two, we are going to discuss ways you can use your now centralized data to identify energy-and cost saving opportunities, including billing errors, malfunctioning meters, facility and utility account ownership issues, and others in pursuit of your reduction goals.
Benchmarking
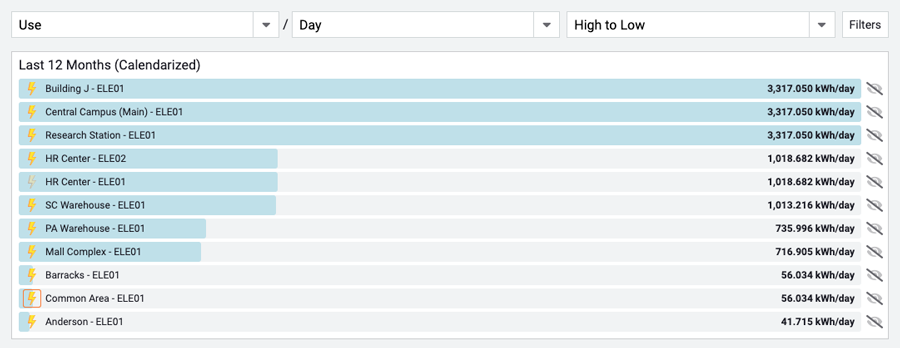
Benchmarking is the practice of comparing the energy use of peer facilities via specific criteria, such as use or cost per square foot, per day, per student, per room-night, per widget produced, and others.
Benchmarking is a quick way to develop a shortlist of potential energy hogs that warrant inspection for savings opportunities.
Following are commonly used benchmarking resources:
1. Utility Company Reports
Your utility vendors may provide regular reports that show how your energy use compares to similar utility company customers. They’re great because they’re free, and they give you a general idea of your building’s energy efficiency.
One drawback to these reports is that they don’t account for all the variables related to your energy use. They may alert you to potential issues, but they often don’t provide enough detail to help you take corrective action.
2. ENERGY STAR Ratings
While this step may not be a requirement of your specific energy reduction mandate, local municipalities often separately require that energy use data for facilities is submitted to ENERGY STAR’s Portfolio Manager application on a quarterly or annual basis. Facility ENERGY STAR scores are then required to be publicly accessible or at least available for review by potential buyers or tenants.
The Portfolio Manager application benchmarks buildings against their peers and assigns a score, or ranking, of 1–100. An ENERGY STAR building score of 75, for example, indicates that, from an energy efficiency perspective, the building performs better than 75% of its peers.
The ENERGY STAR score is a relatively straightforward way to evaluate facility energy consumption and communicate the performance of your entire portfolio compared to a large national database of facilities. Note that your buildings may not always perfectly align with ENERGY STAR categories, and not all building types are eligible for an ENERGY STAR rating.
3. Industry-Specific Benchmarking
It’s common for industries and trade groups to supply their own benchmarks. An industry-related benchmarking system is likely to be very relevant to your facility portfolio and, therefore, can be quite useful, assuming the sample size of peer facilities—similar building types, use, geographic location—is statistically significant.
4. Software Tools
Benchmarking is a feature you’ll often find in energy management software. For example, the Groups & Benchmarks feature in the EnergyCAP utility bill accounting and energy management software automates peer benchmarking and allows the user to benchmark facilities via custom or industry-specific factors, such as hours of operation or building occupancy.
Bill Audits
{{cta(‘176f3c9f-3704-446e-aeae-835fb8b1a97f’,’justifyright’)}}You never want to pay for energy you didn’t use, which is why bill audits are so useful. Your organization’s utility bills are packed with data that can be inspected for errors, and identifying those errors can result in substantial cost savings. Utility bill audits typically fall into four categories:
1. Date Audits As you might expect, date audits revolve around comparing utility bill date information. The start and end dates of your bills, the statement date, the due date, and the billing period length are all important dates to check.
We recommend that you begin your utility auditing process with a focus on date accuracy. Date audits that may reveal data entry errors or other billing-related issues include the following:
Billing Period Length is abnormally long or abnormally short
A gap between End Date of last bill and Start Date of the current bill
Bill End Date is later than today
Due Date or Statement date is before the End Date
Bill Start/End Dates overlap with another bill
Date audits are useful because date-related errors lead to incorrect energy analytics and untrustworthy audit results. When you’re comparing different billing periods to determine the average daily use or average daily cost of a facility, it’s essential for all dates to be correct.
2. Energy Use Audits
Energy use audits expose incorrect meter reads, faulty meters, billing errors, and data entry errors. The first time you perform an energy use audit, you may reveal persistent issues and problems that can save your organization tens or even hundreds of thousands of dollars.
Here are some examples of energy use audits that may reveal billing issues:
An account has several consecutive estimated bills. Too many consecutive estimated bills indicates that the utility vendor can’t access the meter.
Use-per-day is identical to the prior bill. It’s extremely unlikely for commodity use to be the exact same for consecutive billing periods. When this happens, check to see if the bill is estimated.
Cost without use. If you receive a bill with a cost attached to it but it shows no commodity use, it could mean that the meter is inactive and should not incur expenses.
3. Cost Audits Cost audits can also help uncover faulty meters, billing errors, and data entry mistakes. They can be a bit trickier to perform, however, since utility rates can change significantly between billing periods due to electric demand, seasonality, use, and ratchet situations. Nevertheless, there are a few audits you can perform to check for savings opportunities:
The cost-per-day for a meter is higher than previous bills. For meters that are relatively steady month to month, a higher cost-per-day could indicate that there’s an issue. When performing this audit, also look at the monthly cost and unit cost data for additional insights.
Year over year changes. This audit is better for meters that experience seasonal changes. If the cost-per-day or unit cost is notably different from the same month of the previous year, it’s worth a closer look. This jump could indicate a rate change or increased usage.
4. Demand Audits Demand audits only apply to electric bills, but they’re still very useful. Demand is the potential “peak use” (maximum kW) of a meter for a billing period. The electric supplier must be prepared to supply this demand at any time, and they often charge a rate premium based on this use that can impact your rates in future months.
You can reduce your peak energy use through retrofits, load reallocation, and other practices. For example, a school system can reduce its demand by using the art department’s pottery kiln when the school’s kitchen is not in use.
Any industry that has flexibility when it comes to scheduling energy-intensive activities should make use of load reallocation.
Here are a couple important demand audits:
Impossibly high load factors. Any load factor over 100 percent is impossible, so this automatically indicates a billing error.
The demand is higher than all the previous 12 months. Like cost and use audits, this audit leads to asking if the demand is reasonable.
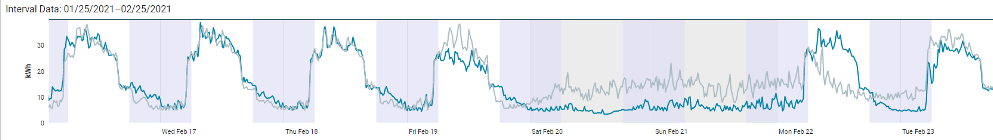
Interval Data
If utility bill data is the energy management world’s superhero, interval data is its critical sidekick. While utility bill data presents a valuable big picture view of energy use and cost, interval data zooms in to help you understand how much energy is being used and when.
Interval data is recorded by the vendor meter or through a self-installed submeter that tracks usage details in smaller increments. This enables you to ask and answer questions, such as:
Does this building start using energy at the expected time each day?
Does energy use decrease or stop as expected during the evenings and on weekends?
Are there any spikes in demand that could be pushing up costs?
If you notice irregularities during 15-, 30-, or 60-minute intervals, you can make adjustments that yield significant cost and energy savings. Analysis of interval data may also tip you off to equipment that is no longer operating efficiently. The data will help you build the case for purchasing more energy-efficient and environmentally friendly equipment.
Reports
At this stage, you have a ton of data to work through, and there are many different reports you can compile to identify potential issues. You’ll also be able to report on your successes as you work toward achieving your energy reduction goals.
With so much data at your fingertips, however, it can be difficult to determine what reports will most effectively spot these issues and prime you to make informed decisions.
Here are a few reports with which every facility and energy manager should be familiar:
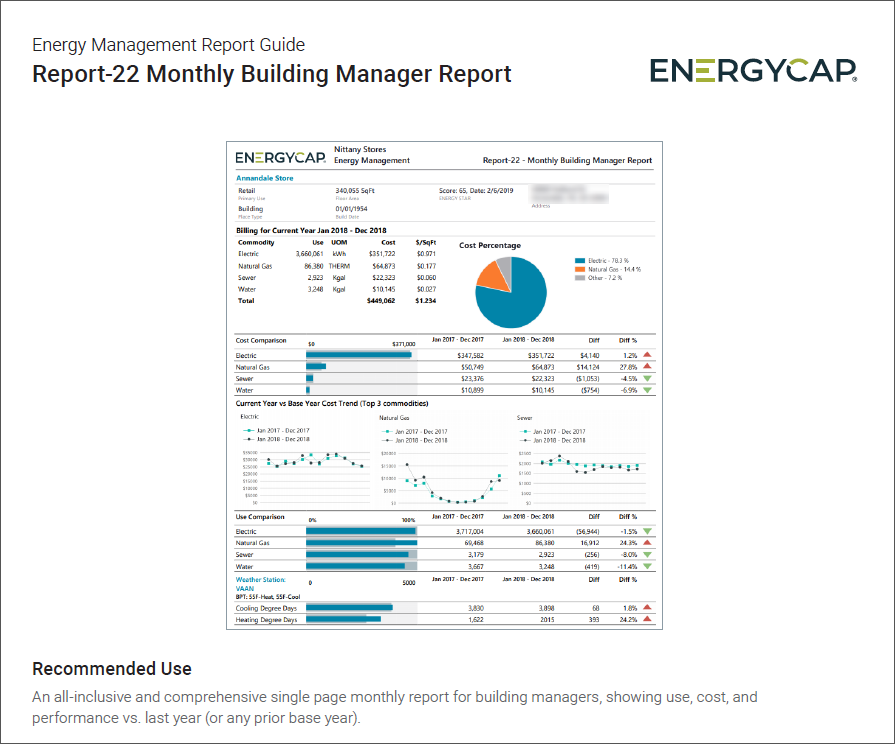
Monthly Building Manager Report: A comprehensive report that building managers use to review the use, cost, and performance of all facilities in comparison to the previous year (or any year)
Two-Year Comparison: Compare and rank cost, use, and performance of each building or department year-over-year
Summary by Commodity: A simple summary detailing the total use and cost of a building, department, or an entire organization for a selected time period
Monthly Utility Use and Cost Report: This report should consist of 1–3 years of monthly data, organized by meter, account, building, and department.
The data contained within your now-centralized energy management database is a dream-come-true for those tasked with procuring energy for your organization. Armed with, ideally, a few years of data and a thorough understanding of energy use patterns, your buyers will be able to negotiate with energy suppliers from a position of power.
How EnergyCAP Can Help
As you work to uncover savings opportunities in your utility bill and interval data, remember that EnergyCAP’s comprehensive solution—industry-leading software, utility bill processing, and consulting services—can make the process much easier and more efficient:
Utility bills are audited automatically as they are entered.
Bills approved for payment are exported in a format that is ready for AP import.
Peer buildings and meters are benchmarked by EnergyCAP based on standard and user-defined criteria.
Interval data can be imported via an automated process, so it’s readily available for analysis.
Report subscriptions ensure that reports are delivered to users when they want them.
Next up, the final installment of this three-part blog series will address how you can verify your progress toward energy reduction goals and mandates and share your energy management successes throughout your organization and with the public.
This website stores cookies on your computer. These cookies are used to collect information about how you interact with our website and allow us to remember you. We use this information in order to improve and customize your browsing experience and for analytics and metrics about our visitors both on this website and other media. For more information, read our Privacy Policy.
Functional
Always active
The technical storage or access is strictly necessary for the legitimate purpose of enabling the use of a specific service explicitly requested by the subscriber or user, or for the sole purpose of carrying out the transmission of a communication over an electronic communications network.
Preferences
The technical storage or access is necessary for the legitimate purpose of storing preferences that are not requested by the subscriber or user.
Statistics
The technical storage or access that is used exclusively for statistical purposes.The technical storage or access that is used exclusively for anonymous statistical purposes. Without a subpoena, voluntary compliance on the part of your Internet Service Provider, or additional records from a third party, information stored or retrieved for this purpose alone cannot usually be used to identify you.
Marketing
The technical storage or access is required to create user profiles to send advertising, or to track the user on a website or across several websites for similar marketing purposes.

 Best-in-class portfolio-level energy and utility bill data management and reporting.
  Real-time energy and sustainability analytics for high-performance, net-zero buildings.
  A holistic view of financial-grade scope 1, 2, and 3 carbon emissions data across your entire business.
  Energy and sustainability benchmarking compliance software designed for utilities.