
"It is incredible to me what shared challenges and situations higher ed has and EnergyCAP really really gets that, which I appreciate."


Headquarters
EnergyCAP, LLC
360 Discovery Drive
Boalsburg, PA 16827
Denver, CO
Suite 500
5445 DTC Parkway
Greenwood Village, CO 80111
Dublin, Ireland
Unit F, The Digital Court, Rainsford Street,
Dublin 8, D08 R2YP, Ireland
Phone: 877.327.3702
Fax: 719.623.0577
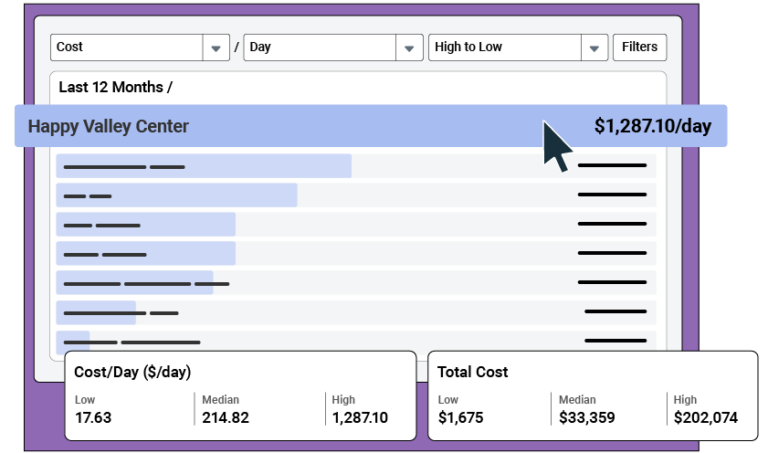
Benchmarking your buildings, both by tracking a building’s changes over time and comparing performance against other buildings in your portfolio, is crucial to managing energy usage. The EnergyCAP's energy benchmarking capabilities compares and visualizes the performance of similar buildings and meters. Group members can be compared by valuable metrics like cost-per-area and per-day, use-per-area and per-day, peak demand, and unit cost.
Energy benchmarking involves the systematic tracking, analyzing, and comparing of energy consumption across buildings or facilities to identify opportunities for improvement and cost savings. Comparison helps identify which of your buildings are energy stars, and which are energy hogs. From there, you can prioritize energy efficiency investments and allocate resources effectively. Because benchmarking provides a baseline for tracking energy performance over time, it’s easy to measure the impact of energy conservation projects and identify energy consumption trends.
To see how your building’s energy performance stacks up against thousands of similar properties across the U.S., our free energy benchmarking tool can calculate your building’s Energy Usage Intensity (EUI).
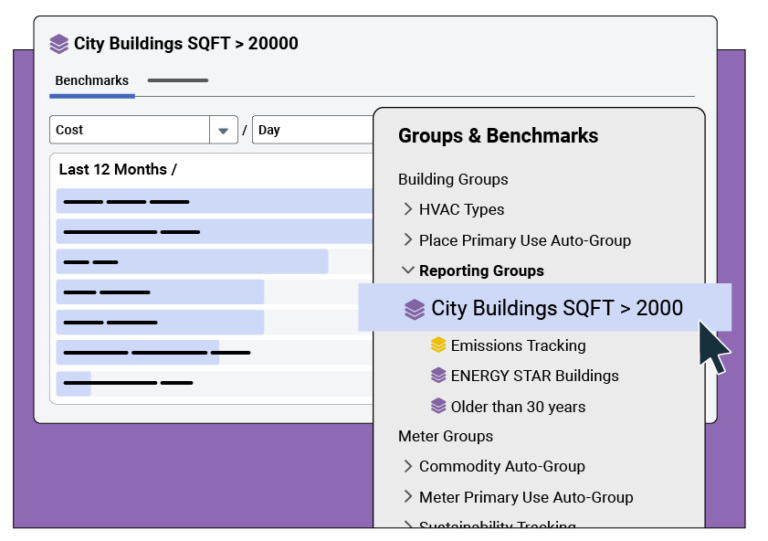
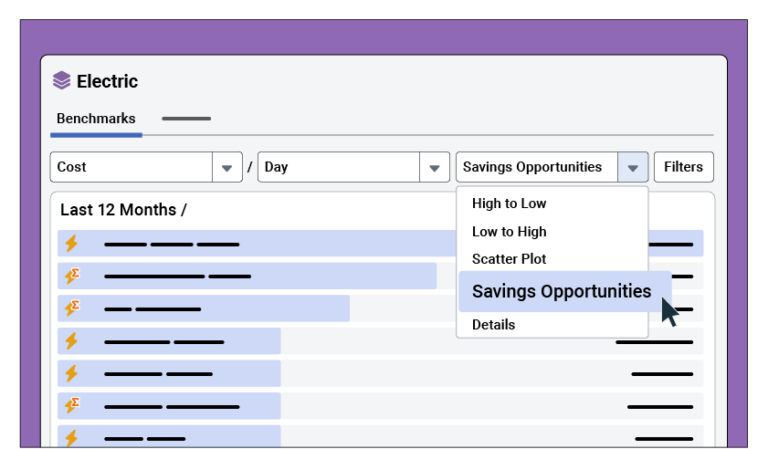
When utilizing energy benchmarking solutions, there are multiple ways to organize and compare your data. The most powerful benchmarking metrics highlight buildings and meters with abnormal cost, use, or demand. These often offer the greatest opportunity for cost reduction and energy savings.
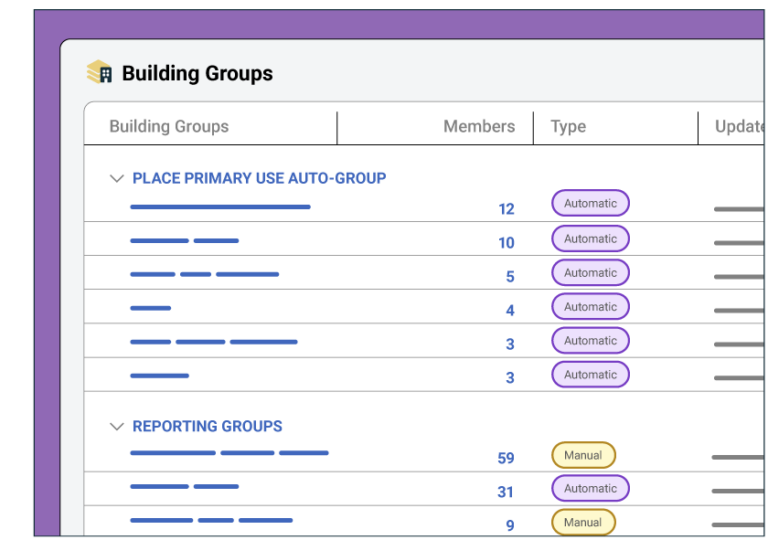
Automatic Groups are lists of buildings that are kept up to date for you by EnergyCAP using filters you configure, like number of occupants, building age, or square footage. You can add attributes to buildings and meters and create an unlimited number of automatic groups.
Manual Groups have membership maintained by you. You control which buildings belong in a manual group. Popular groups include “Top 10” most intensive for energy use, cost, or use/cost per square foot.
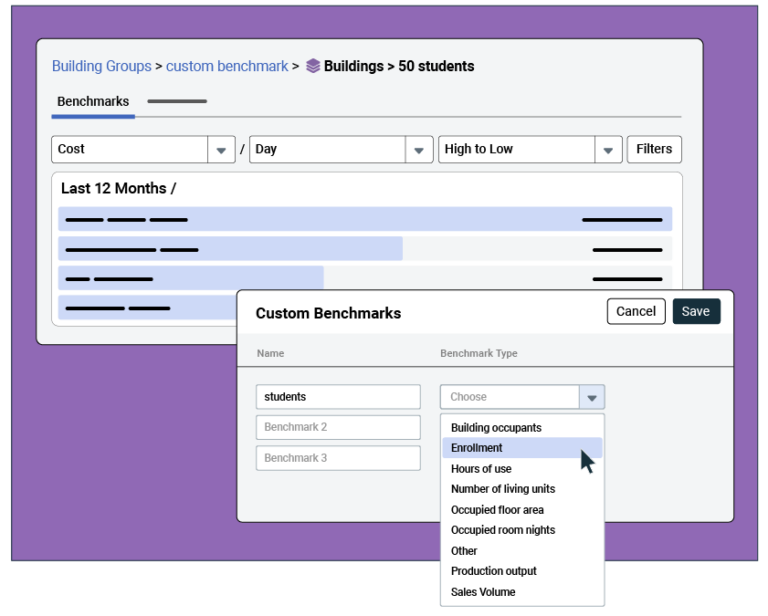
Beyond basic metrics like energy use per square foot, Custom Building Benchmarks give you additional methods to group and rank your buildings. You can benchmark against variables like occupancy, production output, or operating hours, providing deeper insights into performance drivers. This granular control ensures that your benchmarking efforts yield meaningful and actionable intelligence. Custom building benchmarks:
Effective energy benchmarking requires accurate data collection, consistent monitoring, and the use of standardized metrics to ensure meaningful comparisons and actionable insights. EnergyCAP’s groups and benchmarking capabilities do the work for you to highlight top performers, identify areas for improvement, and track progress over time.
With EnergyCAP, you get a snapshot of a building's energy performance, making it easier to spot energy waste and achieve cost savings.