How EUI benchmarking works in EnergyCAP
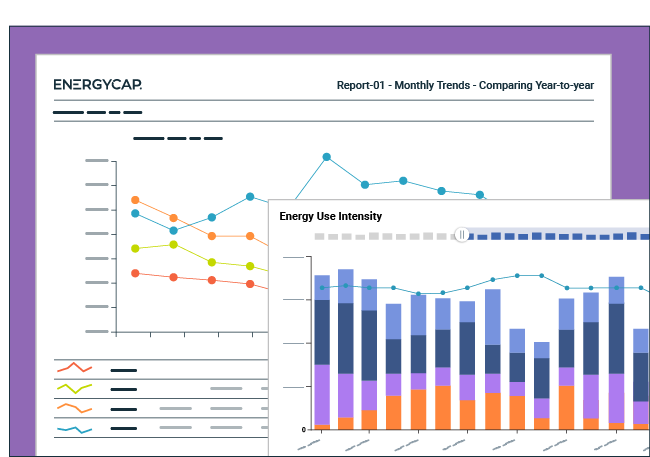
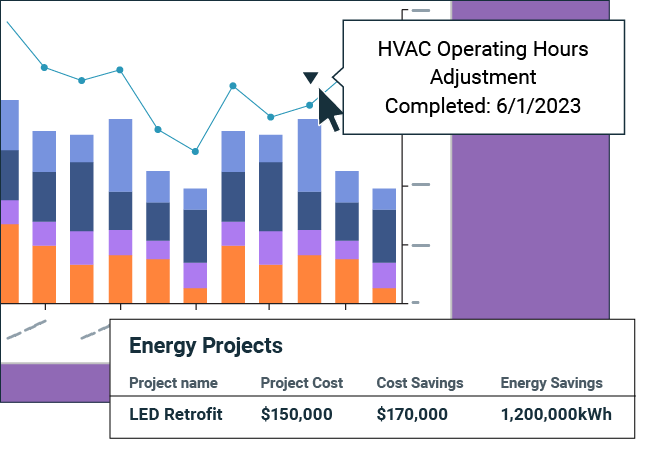
EnergyCAP uses weather-normalized energy use to calculate annualized EUI and displays it on a trend chart. EnergyCAP can also roll up EUI values at every level of the organizational hierarchy. This functionality provides a valuable picture of long-term energy efficiency trends for each department, division, region, and business unit, as well as for the entire organization.
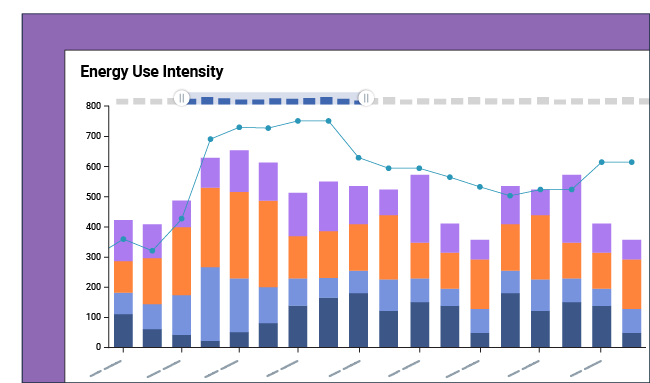
The EUI trend chart plots all energy commodities for a building or organization (excluding water, refuse, etc.), and provides a rolling 12-month average trendline where each data point is the sum of global use for the prior 12 months divided by the maximum floor area in the same 12 month period. Customizing the data you see on the chart is a click away.