




Most retail organizations run their fiscal year on the NRF’s retail calendar, which starts February 1. That means while store teams are still deep in the holiday rush, finance and facili...



Headquarters
EnergyCAP, LLC
360 Discovery Drive
Boalsburg, PA 16827
Denver, CO
Suite 500
5445 DTC Parkway
Greenwood Village, CO 80111
Dublin, Ireland
Unit F, The Digital Court, Rainsford Street,
Dublin 8, D08 R2YP, Ireland
Phone: 877.327.3702
Fax: 719.623.0577
Most retail organizations run their fiscal year on the NRF’s retail calendar, which starts February 1. That means while store teams are still deep in the holiday rush, finance and facilities leaders are already closing out next year’s budget. Utility and energy spend rarely gets a hard look in that process, even though retail utility costs are rising faster than inflation with no sign of slowing down. This is the window to change that: here’s what’s driving the increases, what retail’s own data reveals about the gap between budget confidence and budget accuracy, and what finance and facilities teams can put in front of that budget conversation before it closes.
U.S. electric rates rose 2.6% faster than inflation from 2024 to 2025, and commercial and industrial rates are up 26 to 27% since 2019. Utilities requested $18 billion in rate hikes in 2025 alone, and regulators approved 64% of the dollar value requested. California, Maine, and the Northeast and Mid-Atlantic saw the steepest increases, driven largely by transmission, distribution, and wildfire-mitigation spending, according to Utility Dive. None of that is retail-specific, but retail feels it at scale: a rate increase that adds a few hundred dollars a month to one building adds a few hundred thousand across a 200-store portfolio.
At the same time, tariffs and trade-policy shifts are squeezing margin from the other direction. Nearly every retail executive expects higher costs from trade policy this year, and most are already raising prices and shifting product mix just to protect margin, per Deloitte’s 2026 retail industry outlook. That leaves utility and energy spend as one of the few operating cost lines finance can still act on directly, rather than pass through to the customer.
Retail organizations reported the highest confidence of any surveyed sector in their budget accuracy and their ability to hit energy and utility goals, according to EnergyCAP’s 2026 State of Utilities research. The same research found that half of retail respondents still manage energy with reactive or manual processes, and a third run the function with three people or fewer. Eighty-six percent said their utility costs increased over the past year, tied with healthcare for the highest of any sector surveyed.

That gap matters heading into a budget cycle. Confidence built on manual processes and thin staffing is hard to defend when a controller, auditor, or landlord asks for the number behind the number. Triple-net lease structures compound the problem: retail energy teams often don’t control the building systems driving the cost, and getting clean meter data out of a landlord-managed account is its own project. Add 24/7 refrigeration load in grocery and food retail, and the baseline cost, before any of this year’s rate increases, is already high.
Utility spend is a real operating expense line, and most utility data doesn’t meet the bar finance actually needs: late or incorrect bills delay close, accruals get built on best guesses, and there’s no audit trail to defend the number when it’s questioned. EnergyCAP produces financial-grade data with complete audit trails, so utility spend can be forecast, budgeted, and defended the same way any other major expense line is.
In a recent customer survey, EnergyCAP customers who identify energy conservation measures through the platform reported average annual savings equal to 5% of utility spend, and EnergyCAP customers save an average of $250,000 per logged efficiency project. Building a number like that into next year’s budget conversation is a very different pitch than asking for more headcount to keep doing the same manual process.
EnergyCAP customers who identify energy conservation measures through the platform reported average annual savings equal to 5% of utility spend, and EnergyCAP customers save an average of $250,000 per logged efficiency project.
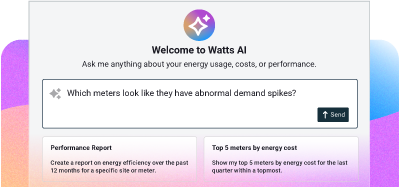
Facilities teams don’t usually find out about a cost spike until the bill arrives, and by then the only conversation left is explaining it after the fact. Across a leased retail portfolio, that problem multiplies by every store, every landlord relationship, and every different way utility data shows up: a portal here, a paper bill there, a vendor EDI feed somewhere else. EnergyCAP centralizes that data regardless of source and benchmarks performance store to store, so a spike at one location gets flagged before it becomes a pattern across twenty.
In a recent customer survey, 100% of EnergyCAP customers said the platform improved their visibility into utility spending, and 98% said it improved their confidence in the accuracy of their data—exactly the kind of visibility that turns a defensive conversation about last month’s bill into a proactive one about next year’s budget.
100% of EnergyCAP customers said the platform improved their visibility into utility spending, and 98% said it improved their confidence in the accuracy of their data—exactly the kind of visibility that turns a defensive conversation about last month's bill into a proactive one about next year's budget.

Bring this into the budget conversation and the ask changes shape: instead of requesting more headcount to keep managing utility spend manually, you’re presenting a store-level cost picture, a specific savings number, and a compliance answer already in hand. That’s what turns next year’s budget from one that absorbs another rate increase into one that’s built to catch the next one.