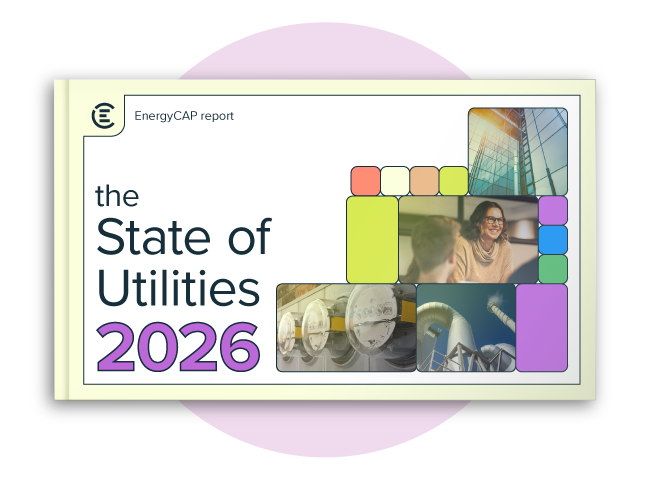
Discover how utilities are responding to one of the industry’s most transformative periods yet. The State of Utilities 2026 report explores the trends reshaping operations, sustainability initiatives, customer engagement, and infrastructure planning, backed by insights from utility leaders and industry data. Find out where organizations are investing, the challenges they’re working to overcome, and the strategies helping them build a more resilient, efficient, and future-ready energy landscape.
Introduction
EnergyCAP has spent four decades in the trenches of utility management, and we’ve supported thousands of organizations as costs, complexity, and scrutiny have climbed.
For our 2026 State of Utilities study, we surveyed hundreds of professionals to understand how organizations are planning, managing, and defending utility spend in a volatile year.
The results are revealing. We found an industry full of resilience: teams that see the value of their data and matured their energy management programs. At the same time, challenges are growing. Utility costs are climbing, budget certainty is slipping as they increase, and many organizations need stronger tools and more buy-in, all while being asked to do more with less.
One theme stands out across the dataset: executives often view energy management very differently than the energy, facilities, and finance teams doing the work day-to-day. In this report, we share the key insights and takeaways from the study to help teams close that gap and move forward with confidence.
Utility costs are rising across every industry, region, and organization type
Key findings:
76%
of respondents report utility costs rising YoY
1 in 5
report year-over-year increases of 10%+
Rising utility costs, and resulting budget increases, are the single most universal finding in the survey. Three-quarters of all respondents are seeing budgets increase, many in the double digits. Less than 5% of respondents are experiencing a downward trend. This cuts across every sector, organization size, and geography.
This backdrop isn’t surprising. Energy prices are rising at twice the rate of inflation, climbing to their highest level in more than two decades. Infrastructure constraints, extreme weather, and the rising energy demand of AI are adding new pressure to an already tight system.
The net effect: energy management gets judged through a financial lens via budget impact, forecast variance, and ROI proof of projects, tools, and investments. Energy, sustainability, and facilities teams are expected to speak the language of finance, but it’s equally critical to educate other teams about the importance of usage, benchmarking, and project metrics.
EnergyCAP’s take
Rising energy costs put the rest of the survey into perspective. Alongside finding and fixing waste, controlling or reducing utility spend tops 2026 priorities. But too often, the first “reveal” of skyrocketing costs is a bill that lands 10%+ higher than expected. And you can’t “make it up next month”—utilities are driven by consumption, so surprises compound until you pinpoint the drivers and correct course.
Our advice:
Budget with confidence. Utility budgets shouldn’t be a copy/ paste of last year’s spend. Normalize for weather, building use, and occupancy.
Scrutinize your bills. Late fees and billing errors are low-hanging fruit that reduce cost without changing a single lightbulb.
Add submeters. Interval data flags leaks and spikes early, supports disputes, and proves ECM savings even when rates rise.
Confidence is mixed, and 100% certainty is the outlier
Across budgeting, goal confidence, and overall strategy, responses cluster in the middle. A meaningful share of respondents report strong uncertainty, most feel “okay”, and a small group reports complete certainty across multiple measures.
Growing uncertainty is expected with energy costs rising at unprecedented rates, even for organizations with strong teams and tools. Volatility doesn’t just raise expenses, it introduces more variance into planning and makes “confidence” harder to claim.
Key findings:
40%+
of respondents are not fully confident that they’ve accurately budgeted for utilities in the next 12 months.
1 in3
organizations aren’t fully confident they’ll hit their energy management
goals, while nearly 60% feel
reasonably confident overall.
54%
(the majority) report that they are
confident or very confident, but
only 5% report 100% surety.
56%
sit in the middle on strategy, describing themselves as working toward better automation insights and forecasting, while 1 in 5 remain reactive and manual.
Rising energy costs put the rest of the survey into perspective. Alongside finding and fixing waste, controlling or reducing utility spend tops 2026 priorities. But too often, the first “reveal” of skyrocketing costs is a bill that lands 10%+ higher than expected. And you can’t “make it up next month”—utilities are driven by consumption, so surprises compound until you pinpoint the drivers and correct course.
Our advice:
Budget with confidence. Utility budgets shouldn’t be a copy/ paste of last year’s spend. Normalize for weather, building use, and occupancy.
Scrutinize your bills. Late fees and billing errors are low-hanging fruit that reduce cost without changing a single lightbulb.
Add submeters. Interval data flags leaks and spikes early, supports disputes, and proves ECM savings even when rates rise.
"What this report captures is something APPA members live every day. Facilities teams in higher education and K–12 are managing complex utility portfolios with lean staff and limited dedicated energy resources. While institutional leadership sees a simplified version of a problem that is anything but simple. That executive-to-practitioner confidence gap is real, and it’s costly. The antidote is data: consistent benchmarking, tracking usage alongside spend, and the ability to translate operational performance into the language that earns institutional investment.”
Lalit Agarwal // President & CEO, APPA
Small teams and toolkits are taking on big goals
Energy management teams are structurally lean. These small teams are simultaneously expected to control costs, reduce consumption, prove success to leadership, and keep data audit-ready, all while navigating tightening budgets and increasing complexity. It’s no surprise that bandwidth shows up as a top blocker across both customers and non-customers, pointing to a structural constraint, not just a staffing issue.
Small teams still drive big outcomes when they rally around shared data and accessible insights. In practice, team growth and tool adoption tend to reinforce each other: once an organization commits to energy management as a program, the data becomes the uniting instrument that brings facilities, finance, and leadership into the work, often unlocking more resources over time.
Key findings:
1 in5
plan to add a new tool this year.
1 in10
rely on a single person as the lone
energy resource.
2.5x
more likely to have teams larger than 10.
70%
report energy management teams
with no more than 6 people.
Chart 4 | Energy management toolset size changes
Keeping the stack about the same: 51%
Planning to add more specialize tools: 19%
Trying to reduce the number of tools: 19%
Not sure: 11%
Chart 5 | Energy management team size (includes cross-team and part-time resources)
EnergyCAP customers are 2.5× more likely to report energy teams of 10+, which signals what happens when teams have the tools to consistently uncover savings and prove results: momentum attracts resources. When a lone energy manager is stuck in spreadsheets and manual utility work, visibility and bandwidth stay limited, so fewer projects get finished, fewer wins get documented, and teams stay small.
Our advice for teams navigating “do more with less”:
Make your current tools work harder. Standardize workflows, invest in data quality, and reduce manual handoffs if you’re unable to add to the stack.
Build a strong business case for the tools you need. Tie your ask to budget variance impact, risks avoided, and measurable cost reduction.
Use data as the rally point. Shared reporting and clear ownership pull cross-functional partners into the program.
The increase in energy rates will also increase the need for energy managers, as well as the need to “schedule” loads so that utilities can have a more level generation profile and avoid racking up huge capital expenditures for new generation. The need for more cheap generation (renewables are a great option) along with energy storage is greater than ever.”
Eric Woodroof, Ph.D. // Founder, ProfitableGreenSolutions.com
Goals and blockers reveal the real divide: everyone wants cost control, but teams get stuck in different places
In 2026, the headline stays consistent: cost control sits at the center of energy management for everyone. “Find and fix waste faster” also lands near the top across the board, signaling a shift toward continuous performance management.
After those shared priorities, the paths diverge. Non-customers lean into forecasting and leadership visibility, which points to a foundational need: defensible numbers and clearer reporting to support budgets and planning. EnergyCAP customers prioritize the metrics that identify the biggest drivers of consumption and cost, especially EUI/use intensity, suggesting they’re further along in translating data into outcomes and targets.
Blockers mirror that split. Bandwidth hits everyone, but the “why” differs: customers often know what to fix next and get stalled at budget approval for ECMs, while external respondents are still building the foundation—more complete data and dedicated internal resources to run the program at all.
Key findings:
Top goals
EnergyCAP customers prioritize the key metric in reducing consumption and cost, intensity/EUI reduction, at 4x the rate of non-customers.
Controlling or reducing utility spend ranks as the #1 goal across both EnergyCAP customers and non-customers
“Find and fix waste faster” is a top-three goal for everyone
From there, priorities split: non-customers need better forecasting and leadership visibility, while EnergyCAP customers prioritize metrics that surface the biggest drivers of consumption and cost
Blockers
Bandwidth constraints show up as a top-three blocker for everyone, along with cross-team alignment farther down
Customers prioritize budget needs for the ECMs they want to pursue
External respondents need the basics: more and better data, and dedicated internal energy management resources to launch or run their program
Chart 6 | What are your top utility management goals for 2026? (external responses)
Chart 7 | External respondents blockers to achieving energy management goals
Need more data (interval data, etc.): 24%
Lack of time and staff: 18%
Need dedicated internal energy management resources: 17%
Cross-team alignment: 17%
Lack of budget: 13%
No standard processes: 10%
Other: 1%
Chart 8 | Customer top 5 2026 utility management goals
Chart 9 | Customer blockers to achieving energy management goals
Strengthen visibility and reporting for leadership
35
Label
Value
wdt_ID
wdt_created_by
wdt_created_at
wdt_last_edited_by
wdt_last_edited_at
Label
Value
17
rachel-energycap
19/05/2026 04:52 PM
rachel-energycap
19/05/2026 05:14 PM
Need more data (interval data, etc.)
24
18
rachel-energycap
19/05/2026 04:53 PM
rachel-energycap
19/05/2026 05:13 PM
Lack of time and staff
18
19
rachel-energycap
19/05/2026 04:53 PM
rachel-energycap
19/05/2026 05:14 PM
Need dedicated internal energy management resources
17
20
rachel-energycap
19/05/2026 04:54 PM
rachel-energycap
19/05/2026 05:14 PM
Cross-team alignment
17
21
rachel-energycap
19/05/2026 04:54 PM
rachel-energycap
19/05/2026 05:14 PM
Lack of budget
13
22
rachel-energycap
19/05/2026 04:54 PM
rachel-energycap
19/05/2026 05:15 PM
No standard processes
10
23
rachel-energycap
19/05/2026 04:54 PM
rachel-energycap
19/05/2026 05:14 PM
Other
1
Label
Value
wdt_ID
wdt_created_by
wdt_created_at
wdt_last_edited_by
wdt_last_edited_at
Label
Value
24
rachel-energycap
19/05/2026 05:23 PM
rachel-energycap
19/05/2026 05:23 PM
Control or reduce total utility spend
71
25
rachel-energycap
19/05/2026 05:23 PM
rachel-energycap
19/05/2026 05:23 PM
Reduce usage intensity
47
26
rachel-energycap
19/05/2026 05:23 PM
rachel-energycap
19/05/2026 05:23 PM
Find and fix waste faster
41
27
rachel-energycap
19/05/2026 05:24 PM
rachel-energycap
19/05/2026 05:24 PM
Improve budget/forecast accuracy
40
28
rachel-energycap
19/05/2026 05:24 PM
rachel-energycap
19/05/2026 05:24 PM
Improve bill accuracy and reduce rework
39
Label
Value
wdt_ID
wdt_created_by
wdt_created_at
wdt_last_edited_by
wdt_last_edited_at
Label
Value
24
rachel-energycap
19/05/2026 05:27 PM
rachel-energycap
28/05/2026 01:27 PM
Lack of budget
35
25
rachel-energycap
19/05/2026 05:27 PM
rachel-energycap
19/05/2026 05:27 PM
Lack of time and staff
26
26
rachel-energycap
19/05/2026 05:27 PM
rachel-energycap
19/05/2026 05:27 PM
Cross-team alignment
14
27
rachel-energycap
19/05/2026 05:27 PM
rachel-energycap
19/05/2026 05:27 PM
Need more data (interval data, etc.)
14
28
rachel-energycap
19/05/2026 05:27 PM
rachel-energycap
19/05/2026 05:27 PM
No standard processes
5
29
rachel-energycap
19/05/2026 05:28 PM
rachel-energycap
19/05/2026 05:28 PM
Other
6
Label
Value
EnergyCAP’s take
This is the big reveal: both customers and non-customers want similar outcomes, but they’re solving different problems. External organizations are working to get the basics right; customers are working to scale impact.
Our advice:
Start where the friction is greatest. If forecasting is the blocker, centralize and validate the data behind the budget; if execution is the blocker, narrow focus to the highest-impact projects and standardize the workflow to deliver them.
Make leadership reporting a bridge, not a finish line: Visibility earns attention, but outcomes earn investment
Translate goals into an operating plan. Top 3 goals, top 3 blockers, and the top investment that will remove the most friction (time, staff, or tools)
"My industry experience has taught me that rallying support to solve complicated energy efficiency problems is very challenging and time consuming. Don’t waste your time fighting the data. Use good tools to organize the data and gather insights so you can spend your personal energy on making change in your organization.”
Thomas Diliberti CEM,CMVP, CIAQP, CLEP // Sr. Manager, Energy & Utility Solutions, EnergyCAP
Measures of success: The best programs track dollars and kWh
Across both groups, the same three KPIs rise to the top: Usage, Total Utility Spend, and Spend vs. Budget variance, just in a different order. From there, the scorecards diverge. EnergyCAP customers track a broader mix that includes benchmarking and project performance, while non-customers stay largely finance-first.
That split signals opportunity on both sides. Financial metrics communicate outcomes and risk in the language leadership expects. On the other hand, usage and benchmarking metrics explain why costs move and reveal the operational levers that actually control utility costs—the #1 energy management goal this year.
Key findings:
3
of the top responses across the board include Usage, Total Utility Spend, and Spend Vs Budget Variance.
Chart 10 | How is success measured for utility management today? (customer)
Chart 11 | How is success measured for utility management today? (external)
Our CEO often talks about the “dollars and kWh” on the utility bill. Both matter. Teams that treat energy as only a finance program miss the biggest levers for cost control: reducing consumption, finding errors, and managing loads. Teams that treat it as only an energy program struggle to earn buy-in, because leadership lives in budgets, variance, and ROI.
Our advice:
Track both dollars and kWh: Pair spend metrics with usage, demand, and benchmarking so you can explain variance and prove progress
Report like a program, not a bill. Use EUI trends and M&V to show improvement
Speak leadership KPIs. Lead with budget impact, risk, and ROI, then connect those outcomes back to the operational drivers that produced them
In conclusion: finding your tribe
Rising utility costs, lean teams, and mixed budget confidence are forcing a shift: energy management gets measured by financial outcomes, but the biggest levers still show up in usage and performance. One of the fastest ways to make progress in a volatile year is to build your tribe: peers, mentors, and communities that share what’s working, pressure-test plans, and help you earn internal buy-in. The strongest programs connect dollars and kWh, and they don’t do it alone.
These are some of our favorites:
Eco Champions. EnergyCAP’s free community, for customers and non-customers alike, for peer sharing, idea exchange, mentorship, practical advice, and training
APPA. Robust Higher-ed facilities network focused on campus operations, utilities, and best-practice exchange. Connect with peers at every level, learn through training online and in-person classes, and join a regional group for tailored connections and local events
IDEA. District energy community for technical guidance, benchmarking, and operator-to-operator insights
AEE. Formal Energy Management certification and coursework, and a professional community for energy and facilities leaders
Get an inside look at the priorities, pressures, and innovations defining the utility industry in 2026. From infrastructure modernization to decarbonization efforts and operational efficiency, this report highlights how utilities are adapting to rapid change while preparing for a more resilient energy future.