


More than 100 organizations told us what a utility bill management platform is actually worth. The answer: a 3X average return on investment, and a lot fewer hours spent chasing bills, catchin...


Headquarters
EnergyCAP, LLC
360 Discovery Drive
Boalsburg, PA 16827
Denver, CO
Suite 500
5445 DTC Parkway
Greenwood Village, CO 80111
Dublin, Ireland
Unit F, The Digital Court, Rainsford Street,
Dublin 8, D08 R2YP, Ireland
Phone: 877.327.3702
Fax: 719.623.0577
Your organization probably tracks utility bills across dozens, or hundreds, of sites. Whether in a basic spreadsheet or a sophisticated system, energy and finance teams in nearly every organization focus closely on how much utilities are costing them. But tracking spend isn’t the same as tracking consumption, or having that consumption turned into quantified emissions for GHG reporting and compliance.
State legislation like California’s SB 253, New York’s proposed Climate Corporate Data Accountability Act (A9072A), and a growing number of state and local building performance standards are turning emissions disclosure from a voluntary exercise into a financial obligation. Many teams are unpleasantly surprised at the amount of work it takes to start emissions accounting from scratch. A formula error in a submitted GHG report doesn’t just delay a deadline: it can trigger an audit. And audits make their way up to the CFO’s desk.
Emissions tracking software closes the gap between the utility data you already have and the audit-ready GHG reports compliance now requires.
Utility costs are a major and growing operating expense, and the compliance stakes around how that energy use is reported are rising alongside them. SB 253 requires large companies doing business in California to disclose Scope 1 and 2 emissions starting in 2026, with Scope 3 to follow. New York’s proposed S9072A extends similar requirements to New York-based companies. And tools like ENERGY STAR® Portfolio Manager® are commonly used as the benchmarking layer that sits between your utility data and your disclosure submissions.
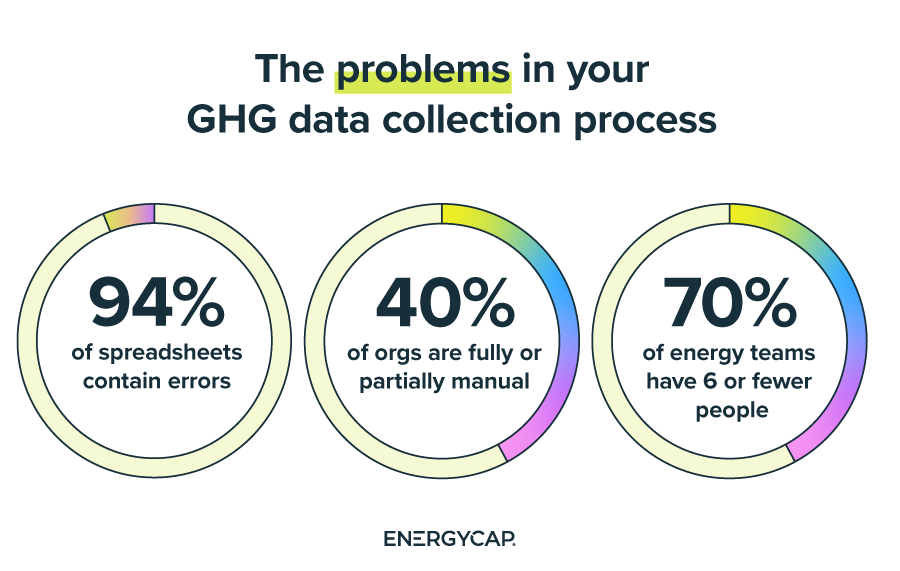
The problem isn’t ambition: it’s data reliability. Research shows that 94% of spreadsheets contain critical errors. For a standard operational report, that’s a nuisance. For a compliance-required GHG submission, it’s a liability. Financial-grade data isn’t just a best practice for emissions reporting: it’s the baseline the process requires.
This is no longer a sustainability team problem. When emissions disclosures carry financial penalties and audit exposure, finance leadership needs to know the data is right before it goes out the door.
Emissions tracking software automates the collection, calculation, and reporting of an organization’s greenhouse gas emissions. For organizations managing large utility portfolios, that means ingesting utility invoice data, such as kWh, therms, and gallons, and applying emissions factors to calculate GHG equivalents automatically: no manual spreadsheets, no re-entry between reporting periods.
A purpose-built platform handles:
The output is a complete GHG inventory: traceable to source data, formatted for common disclosure frameworks, and ready for an auditor to review without manual assembly.
Most organizations managing utility-intensive portfolios already have most of the raw data they need for GHG reporting. The problem is where it lives: billing systems, spreadsheets, and ENERGY STAR uploads that were never designed to produce an audit-ready emissions inventory.
According to EnergyCAP’s 2026 State of Utilities report, nearly half of organizations (42%) are either fully manual or only partially automated with inconsistent data and insights. Seventy percent of energy management teams have six or fewer people. And bandwidth, defined as lack of time and staff, is a top-three barrier for respondents across every sector. Lean teams and growing compliance requirements are on a collision course without automation.
Consider what manual Scope 2 reporting looks like across a 200-site portfolio: pulling kWh data from utility bills, reconciling it against meter reads, applying the correct regional emissions factor for each account, and then assembling a report that has to match the prior quarter’s methodology. That process, repeated every quarter, under compliance deadlines, with a small team, is where errors happen.
Research shows 94% of spreadsheets contain critical errors. For GHG submissions subject to regulatory audit, that risk is unacceptable. The answer isn’t more careful spreadsheet management: it’s eliminating the manual layer entirely.
Not all emissions tracking software is built for organizations that manage large utility portfolios. ESG platforms designed for sustainability consultants often assume that data has already been cleaned and aggregated. For energy and finance teams responsible for dozens or hundreds of utility accounts, the starting point is different. Here’s what matters:
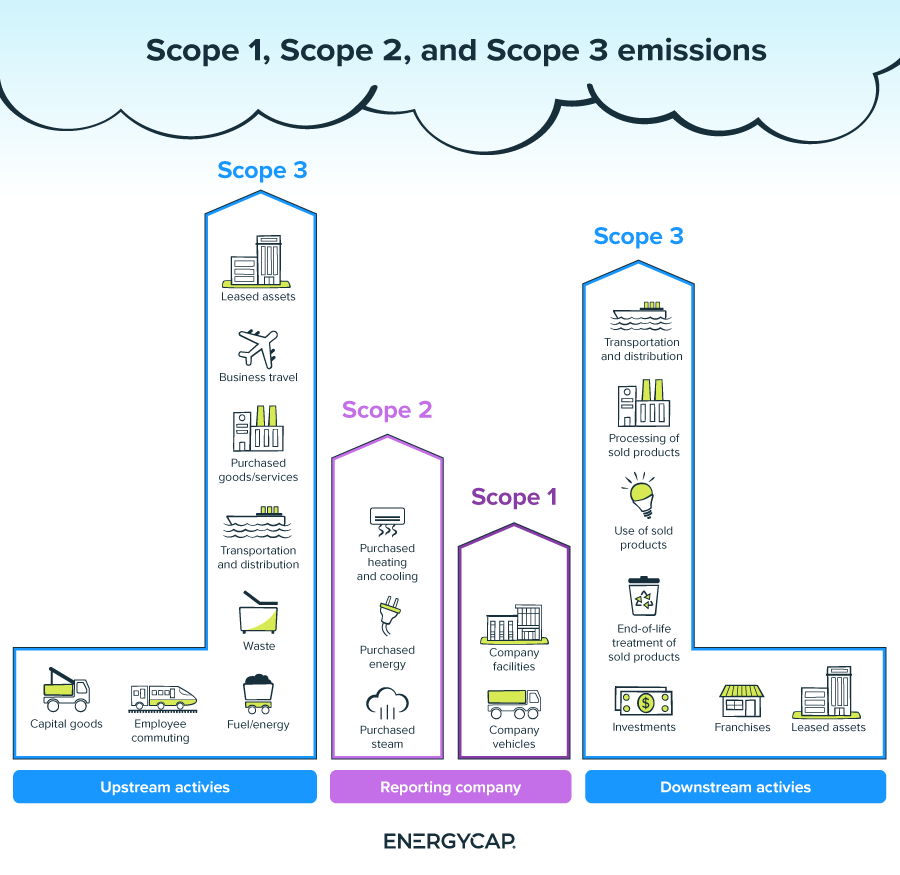
EnergyCAP Emissions is built on top of the same utility data infrastructure energy and finance teams already use to manage costs and consumption. Scope 1 and 2 emissions are automatically generated and tracked from bill, meter, and submeter data as it enters the platform: no separate emissions tool, no manual data transfer, no version control risk. Scope 1 data flows from submeters and chargebacks; Scope 2 is calculated directly from ingested utility bill data; all 15 Scope 3 categories are supported. The result is an emissions inventory that stays current as your utility data does.
Key capabilities include:
The City of Coral Gables, FL uses EnergyCAP to centralize utility data across its municipal portfolio and support sustainability initiatives, with emissions tracking and benchmarking tied directly to the same platform managing utility costs. Because Carbon Hub sits inside EnergyCAP Utility Management, the data that drives your GHG inventory is the same data your finance team uses for budgets and accruals. There is no translation layer between “what we paid for energy” and “what we need to disclose.”
For most organizations managing large utility portfolios, the foundation is already there. EnergyCAP connects to your existing utility data, configures Scope 1, 2, and 3 emissions sources, applies the appropriate factors for each account and commodity, and sets up automated reporting on whatever cadence compliance requires.
The result is a GHG inventory that updates continuously as bills come in: no quarterly scramble, no manual reconciliation, no last-minute version review before a submission deadline.
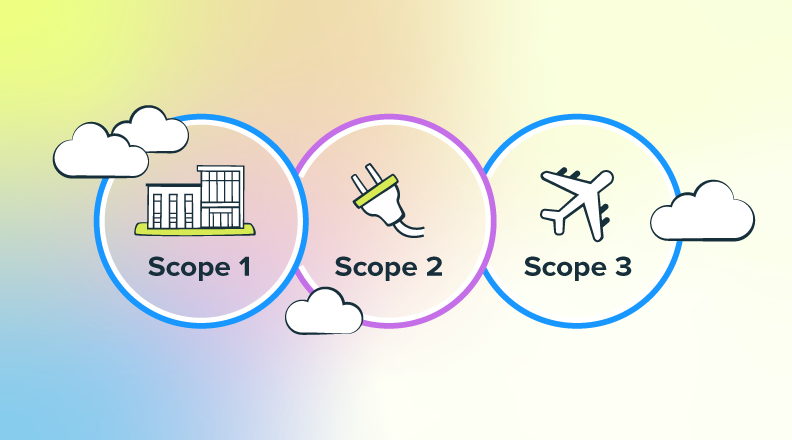
Explore EnergyCAP Emissions and see how it worksEmissions tracking software automates the collection, calculation, and reporting of an organization’s greenhouse gas emissions across Scope 1 (direct emissions from owned sources), Scope 2 (indirect emissions from purchased electricity and heat), and Scope 3 (value chain and supply chain activity). For organizations managing large utility portfolios, it replaces manual spreadsheet processes with a continuous, auditable emissions record that is always current and always traceable.
Scope 1 covers direct emissions from sources your organization owns or controls: on-site boilers, natural gas combustion, company fleet vehicles. Scope 2 covers indirect emissions from purchased electricity, steam, or heat generated elsewhere. Both are required for disclosure under SB 253 and most major reporting frameworks. Scope 2 can be calculated using either location-based factors (regional grid averages) or market-based factors (reflecting energy contracts and RECs), and many frameworks require reporting under both methods.
Purpose-built platforms ingest utility invoice data, including kWh, therms, and gallons, and apply emissions factors to calculate GHG equivalents automatically. In EnergyCAP, this happens within the same system already used to manage utility costs: Scope 2 data is calculated directly from ingested utility bills, and Scope 1 flows from submeter and chargeback data. The data is captured once and used for both financial and emissions reporting, eliminating the re-entry and reconciliation work that creates errors in manual approaches.
It depends on the platform, and on the quality of the underlying data. Audit-readiness means full data lineage (every GHG figure is traceable to a source document), version control (the right calculation was applied at the right time), and no manual assembly that could introduce inconsistencies between reporting periods. EnergyCAP Carbon Hub is designed to meet this standard because the underlying utility data is already structured, validated, and maintained as a financial record.
The terms are often used interchangeably, but there is a meaningful distinction. Carbon accounting software typically refers to a broader category that includes GHG inventory management, carbon offset tracking, and disclosure framework alignment. Emissions tracking software is more specifically focused on the data collection and calculation layer. EnergyCAP Carbon Hub does both, automating Scope 1, 2, and 3 data collection and calculation while producing the audit-ready inventory records compliance requires. The differentiator is that this happens automatically, alongside your utility bill management, without any separate platform or extra work. For more, see our page on carbon accounting software.