


Utility costs are rising, budgets are tightening, and forecasting accuracy has become something organizations can’t afford to get wrong. According to EnergyCAP’s State of Utilities...


Headquarters
EnergyCAP, LLC
360 Discovery Drive
Boalsburg, PA 16827
Denver, CO
Suite 500
5445 DTC Parkway
Greenwood Village, CO 80111
Dublin, Ireland
Unit F, The Digital Court, Rainsford Street,
Dublin 8, D08 R2YP, Ireland
Phone: 877.327.3702
Fax: 719.623.0577

Energy managers, facilities teams, and finance departments all share one challenge: they need accurate, timely utility data to do their jobs, but getting it is far more work than it should be.
EnergyCAP’s 2026 State of Utilities report found that 40% of energy and facilities professionals cite “need more data” as their top barrier to hitting utility management goals, ahead of budget, ahead of staffing. But in most cases, the data exists. The problem is that it arrives as paper bills, PDF invoices, and spreadsheet exports. Someone manually keys it in. Details like demand charges, rate schedules, and line-item fees get dropped. The team that pays the bills and the team that analyzes usage are working from different sources. By the time leadership asks a question, the answer takes hours to produce.
That’s the real cost of managing utility data the manual way: not missing data, but data that’s too slow, too incomplete, and too disconnected to support the decisions that matter.

According to EnergyCAP’s 2026 State of Utilities survey, utility costs are rising for 76% of organizations. One in five is seeing year-over-year increases of 10% or more. When rates and costs are volatile, the teams that can’t see their data clearly are always the last to know something went wrong.

External respondents blockers to achieving energy management goals
The cost of slow utility management isn’t just wasted hours. It’s decisions made without the right information, and opportunities to reduce spend that never surface.
Utility data management is a practice, and like most practices, there’s a wide gap between doing it minimally and doing it well.
At the minimal end: bills get paid, usage gets tracked somewhere, and the team does their best with whatever they can pull from the utility portal. Data is often incomplete. Meter reads live separately from invoice data. Usage and cost can’t be compared directly. The picture is always a little behind, a little uncertain.
At the other end: every bill is captured in full detail including account, meter, commodity, rate schedule, demand charges, line-item fees, and GL code. Usage data connects directly to cost data. Nearly half of organizations (42%) don’t yet have the utility data and insights they need to proactively implement energy management strategies. The organizations that do have something the others don’t: the ability to turn data into action quickly, rather than spending their time organizing it.
For organizations that need help getting there, Bill Capture is EnergyCAP’s managed data service—handling the full bill processing workflow for teams who’d rather spend their time on analysis than data entry. Bill Capture customers save nearly 40 hours of employee time every month on bill processing alone.
The goal of good utility data management isn’t the data itself. It’s what the data makes possible.
Every bill processed through EnergyCAP is checked against account-level configurations and historical data before approval. When an outlier appears, dates that indicate a bill might be missing, a usage reading outside normal range, it’s flagged for review, not processed automatically.
UC San Diego identified a ~$1 million billing error using EnergyCAP’s automated auditing. The issue surfaced immediately, the team validated it against meter data, and the vendor issued a full refund. That outcome requires data depth and automated analysis. It doesn’t happen in a spreadsheet.
More than 40% of organizations aren’t fully confident in their utility budget forecasts. This is a clarity and confidence problem, not a numbers problem. Budgets built from prior-year spend, without accounting for rate changes, weather, or facility shifts, are always one surprise away from being wrong.
When the underlying data is complete and current, budgets can reflect actual usage patterns and rate schedules. Variance tracking keeps the forecast accurate throughout the year. Of survey respondents in 2026, 57% measure program success by spend vs. budget variance. Teams that can show that number consistently are teams that earn credibility with leadership.
“Find and fix waste” ranked in the top three goals for energy professionals in 2026. When usage, cost, and meter data are in the same view, the anomalies worth investigating are exposed. The site running consistently higher than comparable buildings or the meter spiking outside business hours appear without manual digging.
Oklahoma State University has documented $359 million in savings since 2007 and a cost avoidance rate of 18.6% by consistently finding, proving, and acting on what their data revealed. That kind of compounding result comes from a program built on reliable data and not a one-time fix.
70% of energy management teams have six or fewer people. Those teams can’t spend most of their time building reports. When data is structured and current, the reports leadership needs like spend vs. budget, energy use intensity trends, or verified project savings are available without a manual pull every quarter.
EnergyCAP customers are 2.5x more likely to have teams of more than 10 people than non-customers. When programs consistently deliver results that leadership can see and trust, they earn the resources to grow.
The right utility data management tools don’t just make small teams more accurate, they change what those teams can do at all. A team of three that spends two days a week on data entry and report-building has one day left for the work that actually moves the needle. Reduce the overhead, and the analysis, project identification, and savings programs that were impossible on a lean budget suddenly aren’t.
That’s not a technology story, it’s a program story. And it starts with whether your team has data they can trust and act on quickly.
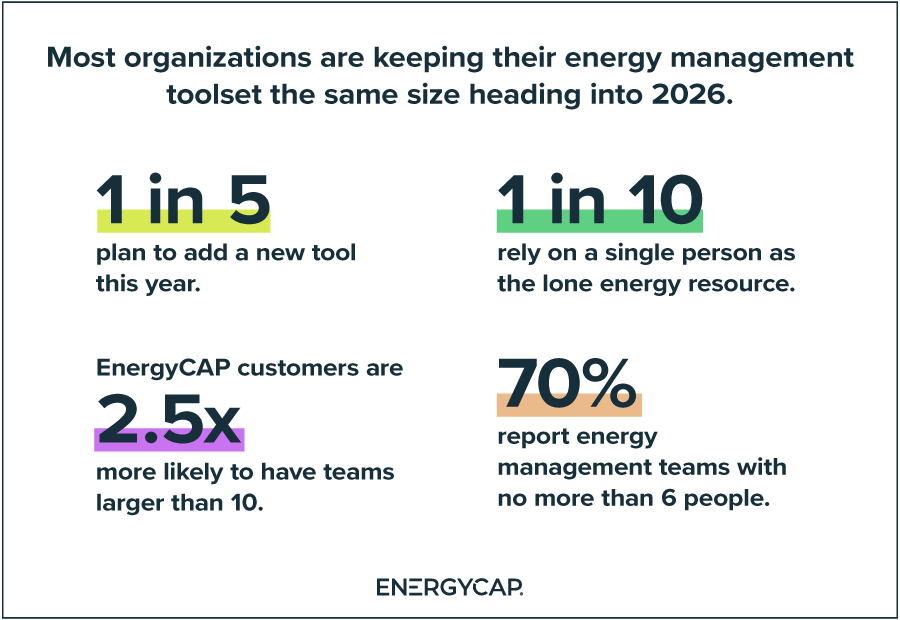
Most organizations are keeping their energy management toolset the same size heading into 2026.
If you’re not sure how well your current utility data management supports your team, these questions can help clarify the gap:
If any of those answers are slower, less certain, or more manual than they should be, the issue usually isn’t effort. It’s infrastructure. The right utility data management platform gives energy, facilities, and finance teams the data depth, analysis tools, and reporting capabilities to stop managing around their data and start using it.
EnergyCAP gives energy, facilities, and finance teams a single platform to capture every detail of their utility data, catch billing errors before they’re paid, and turn months of manual work into minutes. Whether you’re managing five buildings or five thousand, EnergyCAP helps your team spend less time wrestling with data and more time acting on it. Request a demo and see how EnergyCAP can work for your organization.
Request an EnergyCAP demo