


EnergyCAP® offers energy managers a sobering question worth asking: how much did your team find out about last month’s cost spike? And when did you find out? For most teams, the answer i...
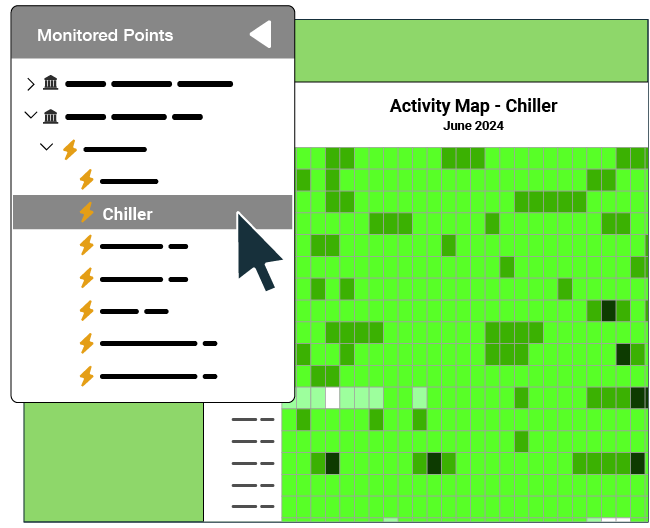
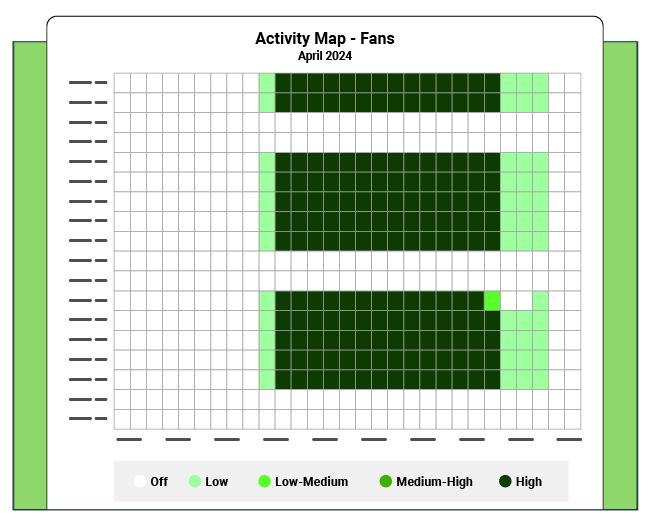
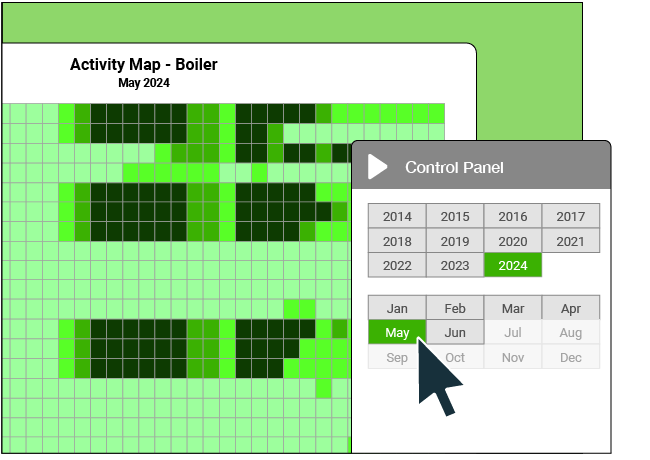
"EnergyCAP Interval Data (fka Smart Analytics) helped me immensely in energy-saving by identifying hidden areas. The technology is unique in what it can do and can find out when HVAC plant is on and...